

7 Mathematical Modelling of Solar Updraft Tower
103
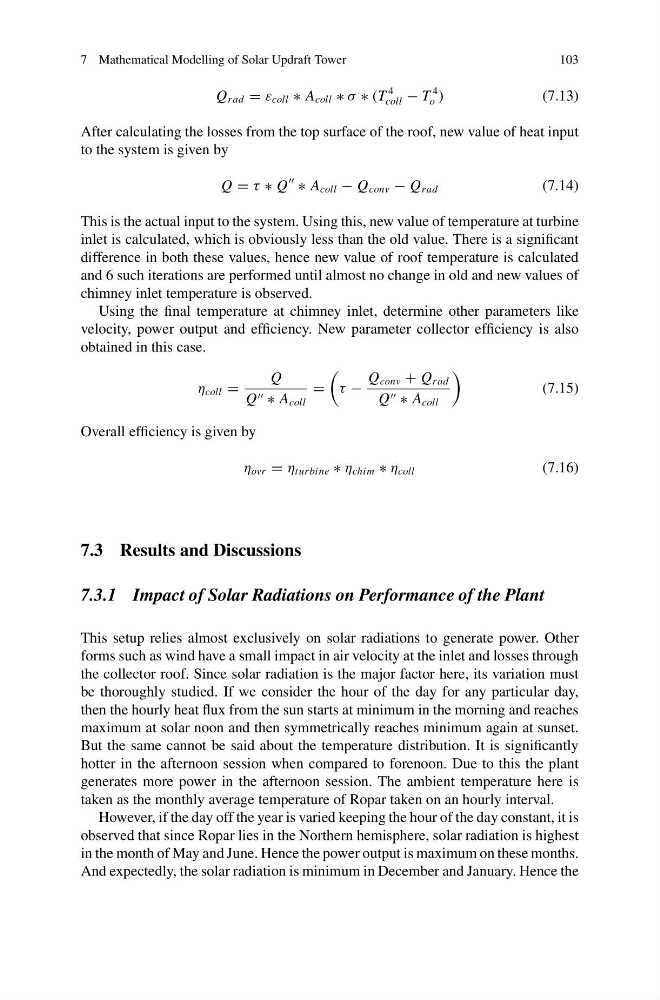
Q rad = ε coll ∗ A coll ∗ σ ∗ (T
4
coll − T
4
o )
(7.13)
After calculating the losses from the top surface of the roof, new value of heat input
to the system is given by
Q = τ ∗ Q
∗ A coll − Q conv − Q rad
(7.14)
This is the actual input to the system. Using this, new value of temperature at turbine
inlet is calculated, which is obviously less than the old value. There is a significant
difference in both these values, hence new value of roof temperature is calculated
and 6 such iterations are performed until almost no change in old and new values of
chimney inlet temperature is observed.
Using the final temperature at chimney inlet, determine other parameters like
velocity, power output and efficiency. New parameter collector efficiency is also
obtained in this case.
η coll =
Q
Q ∗ A coll
=
τ −
Q conv + Q rad
Q ∗ A coll
(7.15)
Overall efficiency is given by
η ovr = η turbine ∗ η chim ∗ η coll
(7.16)
7.3 Results and Discussions
7.3.1 Impact of Solar Radiations on Performance of the Plant
This setup relies almost exclusively on solar radiations to generate power. Other
forms such as wind have a small impact in air velocity at the inlet and losses through
the collector roof. Since solar radiation is the major factor here, its variation must
be thoroughly studied. If we consider the hour of the day for any particular day,
then the hourly heat flux from the sun starts at minimum in the morning and reaches
maximum at solar noon and then symmetrically reaches minimum again at sunset.
But the same cannot be said about the temperature distribution. It is significantly
hotter in the afternoon session when compared to forenoon. Due to this the plant
generates more power in the afternoon session. The ambient temperature here is
taken as the monthly average temperature of Ropar taken on an hourly interval.
However, if the day off the year is varied keeping the hour of the day constant, it is
observed that since Ropar lies in the Northern hemisphere, solar radiation is highest
in the month of May and June. Hence the power output is maximum on these months.
And expectedly, the solar radiation is minimum in December and January. Hence the
103
Q rad = ε coll ∗ A coll ∗ σ ∗ (T
4
coll − T
4
o )
(7.13)
After calculating the losses from the top surface of the roof, new value of heat input
to the system is given by
Q = τ ∗ Q
∗ A coll − Q conv − Q rad
(7.14)
This is the actual input to the system. Using this, new value of temperature at turbine
inlet is calculated, which is obviously less than the old value. There is a significant
difference in both these values, hence new value of roof temperature is calculated
and 6 such iterations are performed until almost no change in old and new values of
chimney inlet temperature is observed.
Using the final temperature at chimney inlet, determine other parameters like
velocity, power output and efficiency. New parameter collector efficiency is also
obtained in this case.
η coll =
Q
Q ∗ A coll
=
τ −
Q conv + Q rad
Q ∗ A coll
(7.15)
Overall efficiency is given by
η ovr = η turbine ∗ η chim ∗ η coll
(7.16)
7.3 Results and Discussions
7.3.1 Impact of Solar Radiations on Performance of the Plant
This setup relies almost exclusively on solar radiations to generate power. Other
forms such as wind have a small impact in air velocity at the inlet and losses through
the collector roof. Since solar radiation is the major factor here, its variation must
be thoroughly studied. If we consider the hour of the day for any particular day,
then the hourly heat flux from the sun starts at minimum in the morning and reaches
maximum at solar noon and then symmetrically reaches minimum again at sunset.
But the same cannot be said about the temperature distribution. It is significantly
hotter in the afternoon session when compared to forenoon. Due to this the plant
generates more power in the afternoon session. The ambient temperature here is
taken as the monthly average temperature of Ropar taken on an hourly interval.
However, if the day off the year is varied keeping the hour of the day constant, it is
observed that since Ropar lies in the Northern hemisphere, solar radiation is highest
in the month of May and June. Hence the power output is maximum on these months.
And expectedly, the solar radiation is minimum in December and January. Hence the