

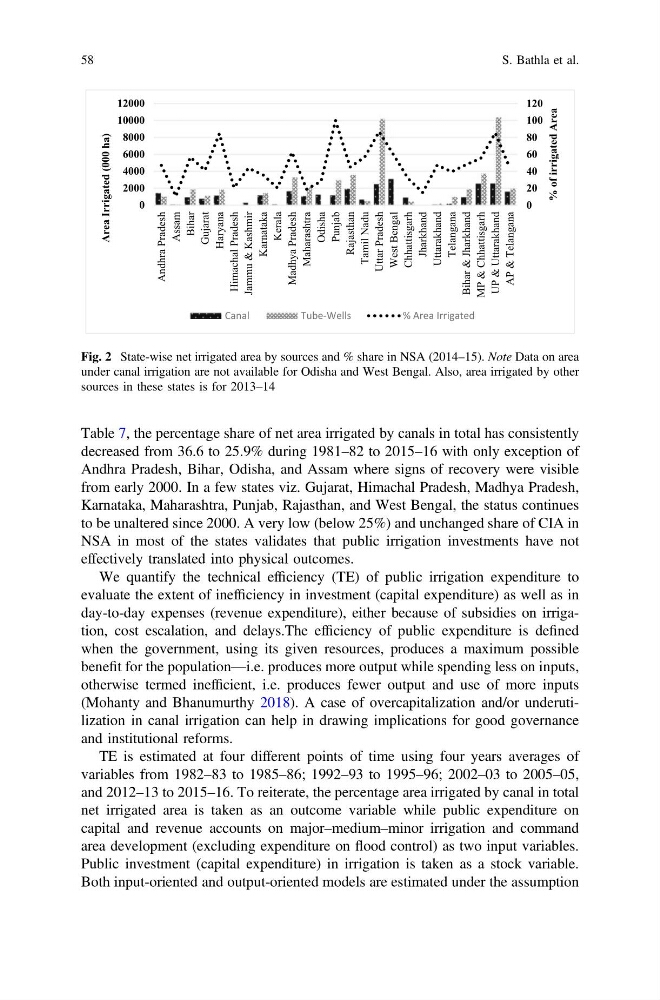
Table 7, the percentage share of net area irrigated by canals in total has consistently
decreased from 36.6 to 25.9% during 1981–82 to 2015–16 with only exception of
Andhra Pradesh, Bihar, Odisha, and Assam where signs of recovery were visible
from early 2000. In a few states viz. Gujarat, Himachal Pradesh, Madhya Pradesh,
Karnataka, Maharashtra, Punjab, Rajasthan, and West Bengal, the status continues
to be unaltered since 2000. A very low (below 25%) and unchanged share of CIA in
NSA in most of the states validates that public irrigation investments have not
effectively translated into physical outcomes.
We quantify the technical efficiency (TE) of public irrigation expenditure to
evaluate the extent of inefficiency in investment (capital expenditure) as well as in
day-to-day expenses (revenue expenditure), either because of subsidies on irrigation, cost escalation, and delays.The efficiency of public expenditure is defined
when the government, using its given resources, produces a maximum possible
benefit for the population—i.e. produces more output while spending less on inputs,
otherwise termed inefficient, i.e. produces fewer output and use of more inputs
(Mohanty and Bhanumurthy 2018). A case of overcapitalization and/or underutilization in canal irrigation can help in drawing implications for good governance
and institutional reforms.
TE is estimated at four different points of time using four years averages of
variables from 1982–83 to 1985–86; 1992–93 to 1995–96; 2002–03 to 2005–05,
and 2012–13 to 2015–16. To reiterate, the percentage area irrigated by canal in total
net irrigated area is taken as an outcome variable while public expenditure on
capital and revenue accounts on major–medium–minor irrigation and command
area development (excluding expenditure on flood control) as two input variables.
Public investment (capital expenditure) in irrigation is taken as a stock variable.
Both input-oriented and output-oriented models are estimated under the assumption
0
20
40
60
80
100
120
0
2000
4000
6000
8000
10000
12000
Andhra Pradesh
Assam
Bihar
Gujarat
Haryana
Himachal Pradesh
Jammu & Kashmir
Karnataka
Kerala
Madhya Pradesh
Maharashtra
Odisha
Punjab
Rajasthan
Tamil Nadu
Uttar Pradesh
West Bengal
Chhattisgarh
Jharkhand
Uttarakhand
Telangana
Bihar & Jharkhand
MP & Chhattisgarh
UP & Uttarakhand
AP & Telangana
% of irrigated Area
Area Irrigated (000 ha)
Canal
Tube-Wells
% Area Irrigated
Fig. 2 State-wise net irrigated area by sources and % share in NSA (2014–15). Note Data on area
under canal irrigation are not available for Odisha and West Bengal. Also, area irrigated by other
sources in these states is for 2013–14
58
S. Bathla et al.
decreased from 36.6 to 25.9% during 1981–82 to 2015–16 with only exception of
Andhra Pradesh, Bihar, Odisha, and Assam where signs of recovery were visible
from early 2000. In a few states viz. Gujarat, Himachal Pradesh, Madhya Pradesh,
Karnataka, Maharashtra, Punjab, Rajasthan, and West Bengal, the status continues
to be unaltered since 2000. A very low (below 25%) and unchanged share of CIA in
NSA in most of the states validates that public irrigation investments have not
effectively translated into physical outcomes.
We quantify the technical efficiency (TE) of public irrigation expenditure to
evaluate the extent of inefficiency in investment (capital expenditure) as well as in
day-to-day expenses (revenue expenditure), either because of subsidies on irrigation, cost escalation, and delays.The efficiency of public expenditure is defined
when the government, using its given resources, produces a maximum possible
benefit for the population—i.e. produces more output while spending less on inputs,
otherwise termed inefficient, i.e. produces fewer output and use of more inputs
(Mohanty and Bhanumurthy 2018). A case of overcapitalization and/or underutilization in canal irrigation can help in drawing implications for good governance
and institutional reforms.
TE is estimated at four different points of time using four years averages of
variables from 1982–83 to 1985–86; 1992–93 to 1995–96; 2002–03 to 2005–05,
and 2012–13 to 2015–16. To reiterate, the percentage area irrigated by canal in total
net irrigated area is taken as an outcome variable while public expenditure on
capital and revenue accounts on major–medium–minor irrigation and command
area development (excluding expenditure on flood control) as two input variables.
Public investment (capital expenditure) in irrigation is taken as a stock variable.
Both input-oriented and output-oriented models are estimated under the assumption
0
20
40
60
80
100
120
0
2000
4000
6000
8000
10000
12000
Andhra Pradesh
Assam
Bihar
Gujarat
Haryana
Himachal Pradesh
Jammu & Kashmir
Karnataka
Kerala
Madhya Pradesh
Maharashtra
Odisha
Punjab
Rajasthan
Tamil Nadu
Uttar Pradesh
West Bengal
Chhattisgarh
Jharkhand
Uttarakhand
Telangana
Bihar & Jharkhand
MP & Chhattisgarh
UP & Uttarakhand
AP & Telangana
% of irrigated Area
Area Irrigated (000 ha)
Canal
Tube-Wells
% Area Irrigated
Fig. 2 State-wise net irrigated area by sources and % share in NSA (2014–15). Note Data on area
under canal irrigation are not available for Odisha and West Bengal. Also, area irrigated by other
sources in these states is for 2013–14
58
S. Bathla et al.