

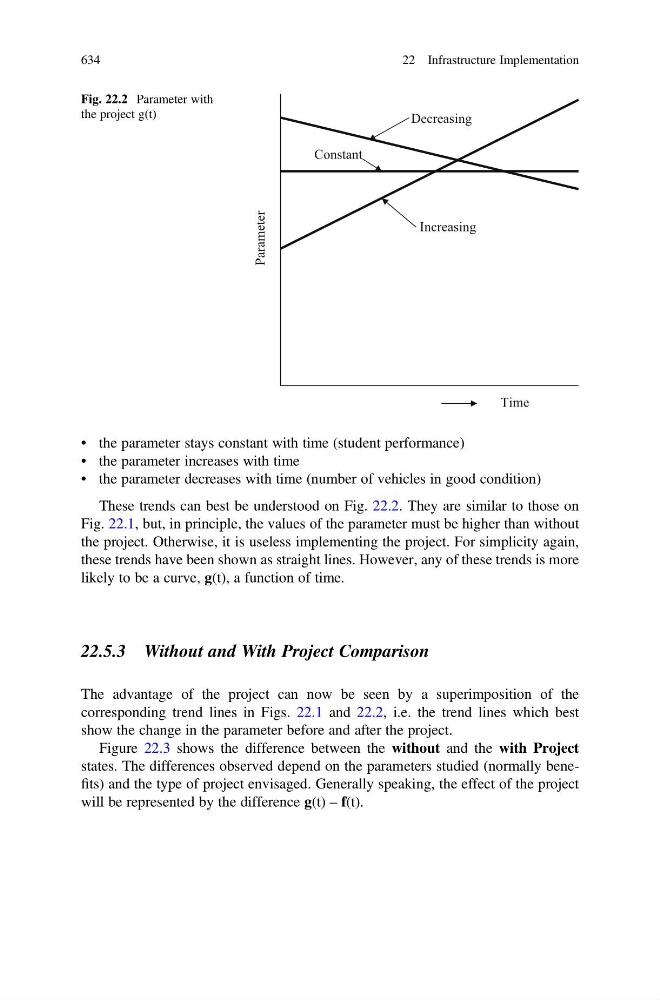
• the parameter stays constant with time (student performance)
• the parameter increases with time
• the parameter decreases with time (number of vehicles in good condition)
These trends can best be understood on Fig. 22.2. They are similar to those on
Fig. 22.1, but, in principle, the values of the parameter must be higher than without
the project. Otherwise, it is useless implementing the project. For simplicity again,
these trends have been shown as straight lines. However, any of these trends is more
likely to be a curve, g(t), a function of time.
22.5.3 Without and With Project Comparison
The advantage of the project can now be seen by a superimposition of the
corresponding trend lines in Figs. 22.1 and 22.2, i.e. the trend lines which best
show the change in the parameter before and after the project.
Figure 22.3 shows the difference between the without and the with Project
states. The differences observed depend on the parameters studied (normally benefits) and the type of project envisaged. Generally speaking, the effect of the project
will be represented by the difference g(t) – f(t).
Parameter
Time
Decreasing
Increasing
Constant
Fig. 22.2 Parameter with
the project g(t)
634
22 Infrastructure Implementation