

Gradually, as Fig. 20.9 shows, due to fatigue, wear and tear, the capability line
will slouch, and some maintenance will be required before the equipment capability
rises to design level, as shown in Fig. 20.9.
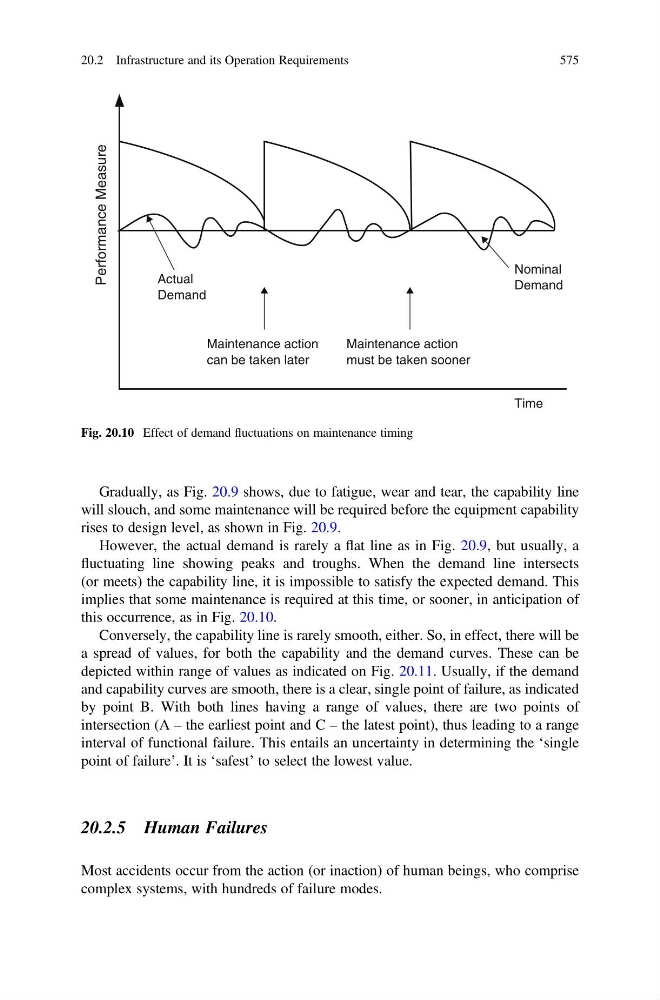
However, the actual demand is rarely a flat line as in Fig. 20.9, but usually, a
fluctuating line showing peaks and troughs. When the demand line intersects
(or meets) the capability line, it is impossible to satisfy the expected demand. This
implies that some maintenance is required at this time, or sooner, in anticipation of
this occurrence, as in Fig. 20.10.
Conversely, the capability line is rarely smooth, either. So, in effect, there will be
a spread of values, for both the capability and the demand curves. These can be
depicted within range of values as indicated on Fig. 20.11. Usually, if the demand
and capability curves are smooth, there is a clear, single point of failure, as indicated
by point B. With both lines having a range of values, there are two points of
intersection (A – the earliest point and C – the latest point), thus leading to a range
interval of functional failure. This entails an uncertainty in determining the ‘single
point of failure’. It is ‘safest’ to select the lowest value.
20.2.5 Human Failures
Most accidents occur from the action (or inaction) of human beings, who comprise
complex systems, with hundreds of failure modes.
Time
Performance Measure
Maintenance action
can be taken later
Maintenance action
must be taken sooner
Nominal
Demand
Actual
Demand
Fig. 20.10 Effect of demand fluctuations on maintenance timing
20.2 Infrastructure and its Operation Requirements
575