

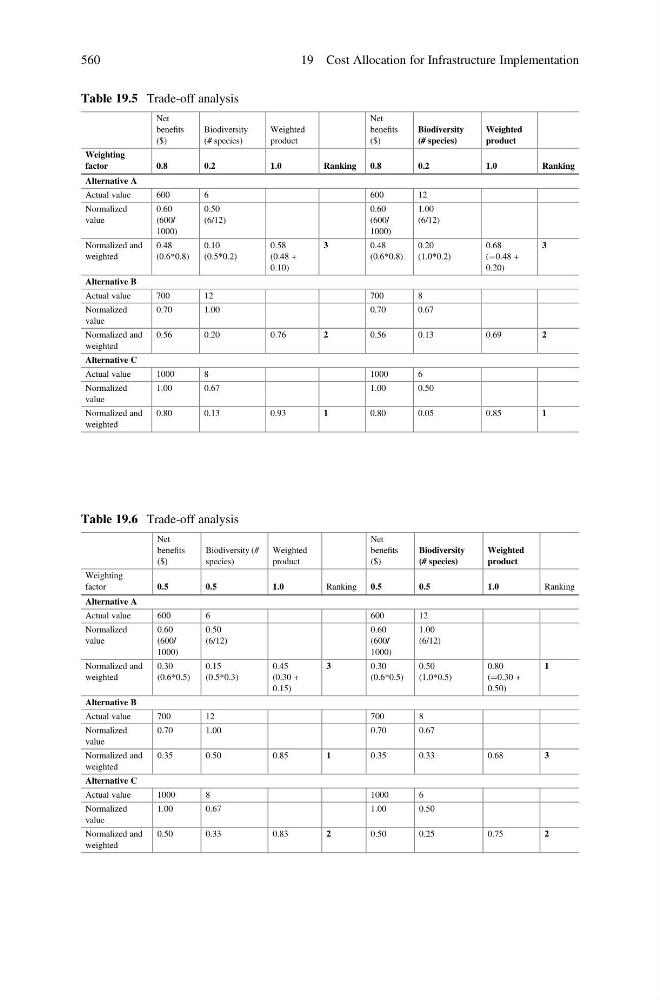
Table 19.5 Trade-off analysis
Net
benefits
($)
Biodiversity
(# species)
Weighted
product
Net
benefits
($)
Biodiversity
(# species)
Weighted
product
Weighting
factor
0.8
0.2
1.0
Ranking
0.8
0.2
1.0
Ranking
Alternative A
Actual value
600
6
600
12
Normalized
value
0.60
(600/
1000)
0.50
(6/12)
0.60
(600/
1000)
1.00
(6/12)
Normalized and
weighted
0.48
(0.6*0.8)
0.10
(0.5*0.2)
0.58
(0.48 +
0.10)
3
0.48
(0.6*0.8)
0.20
(1.0*0.2)
0.68
(¼0.48 +
0.20)
3
Alternative B
Actual value
700
12
700
8
Normalized
value
0.70
1.00
0.70
0.67
Normalized and
weighted
0.56
0.20
0.76
2
0.56
0.13
0.69
2
Alternative C
Actual value
1000
8
1000
6
Normalized
value
1.00
0.67
1.00
0.50
Normalized and
weighted
0.80
0.13
0.93
1
0.80
0.05
0.85
1
Table 19.6 Trade-off analysis
Net
benefits
($)
Biodiversity (#
species)
Weighted
product
Net
benefits
($)
Biodiversity
(# species)
Weighted
product
Weighting
factor
0.5
0.5
1.0
Ranking
0.5
0.5
1.0
Ranking
Alternative A
Actual value
600
6
600
12
Normalized
value
0.60
(600/
1000)
0.50
(6/12)
0.60
(600/
1000)
1.00
(6/12)
Normalized and
weighted
0.30
(0.6*0.5)
0.15
(0.5*0.3)
0.45
(0.30 +
0.15)
3
0.30
(0.6*0.5)
0.50
(1.0*0.5)
0.80
(¼0.30 +
0.50)
1
Alternative B
Actual value
700
12
700
8
Normalized
value
0.70
1.00
0.70
0.67
Normalized and
weighted
0.35
0.50
0.85
1
0.35
0.33
0.68
3
Alternative C
Actual value
1000
8
1000
6
Normalized
value
1.00
0.67
1.00
0.50
Normalized and
weighted
0.50
0.33
0.83
2
0.50
0.25
0.75
2
560
19 Cost Allocation for Infrastructure Implementation
Net
benefits
($)
Biodiversity
(# species)
Weighted
product
Net
benefits
($)
Biodiversity
(# species)
Weighted
product
Weighting
factor
0.8
0.2
1.0
Ranking
0.8
0.2
1.0
Ranking
Alternative A
Actual value
600
6
600
12
Normalized
value
0.60
(600/
1000)
0.50
(6/12)
0.60
(600/
1000)
1.00
(6/12)
Normalized and
weighted
0.48
(0.6*0.8)
0.10
(0.5*0.2)
0.58
(0.48 +
0.10)
3
0.48
(0.6*0.8)
0.20
(1.0*0.2)
0.68
(¼0.48 +
0.20)
3
Alternative B
Actual value
700
12
700
8
Normalized
value
0.70
1.00
0.70
0.67
Normalized and
weighted
0.56
0.20
0.76
2
0.56
0.13
0.69
2
Alternative C
Actual value
1000
8
1000
6
Normalized
value
1.00
0.67
1.00
0.50
Normalized and
weighted
0.80
0.13
0.93
1
0.80
0.05
0.85
1
Table 19.6 Trade-off analysis
Net
benefits
($)
Biodiversity (#
species)
Weighted
product
Net
benefits
($)
Biodiversity
(# species)
Weighted
product
Weighting
factor
0.5
0.5
1.0
Ranking
0.5
0.5
1.0
Ranking
Alternative A
Actual value
600
6
600
12
Normalized
value
0.60
(600/
1000)
0.50
(6/12)
0.60
(600/
1000)
1.00
(6/12)
Normalized and
weighted
0.30
(0.6*0.5)
0.15
(0.5*0.3)
0.45
(0.30 +
0.15)
3
0.30
(0.6*0.5)
0.50
(1.0*0.5)
0.80
(¼0.30 +
0.50)
1
Alternative B
Actual value
700
12
700
8
Normalized
value
0.70
1.00
0.70
0.67
Normalized and
weighted
0.35
0.50
0.85
1
0.35
0.33
0.68
3
Alternative C
Actual value
1000
8
1000
6
Normalized
value
1.00
0.67
1.00
0.50
Normalized and
weighted
0.50
0.33
0.83
2
0.50
0.25
0.75
2
560
19 Cost Allocation for Infrastructure Implementation