

VAR U j
À Á ¼
X n
i¼1
w
2
i VAR x ij
À Á
ð15:8Þ
Thus both the expected values and variances for each of the options under
consideration can be estimated and utilised to identify the best proposal.
Example 15.3
A car manufacturer is assessing three vehicle assembly systems, S 1 , S 2 and S 3 . Three
criteria form the basis for the evaluation, C 1 (reliability), C 2 (ease of maintenance)
and C 3 (cost). The assessors assigned the following normalised importance
weightings to the decision criteria:
• C 1 (reliability) ¼ 0.16
• C 2 (ease of maintenance) ¼ 0.36
• C 3 (cost) ¼ 0.48
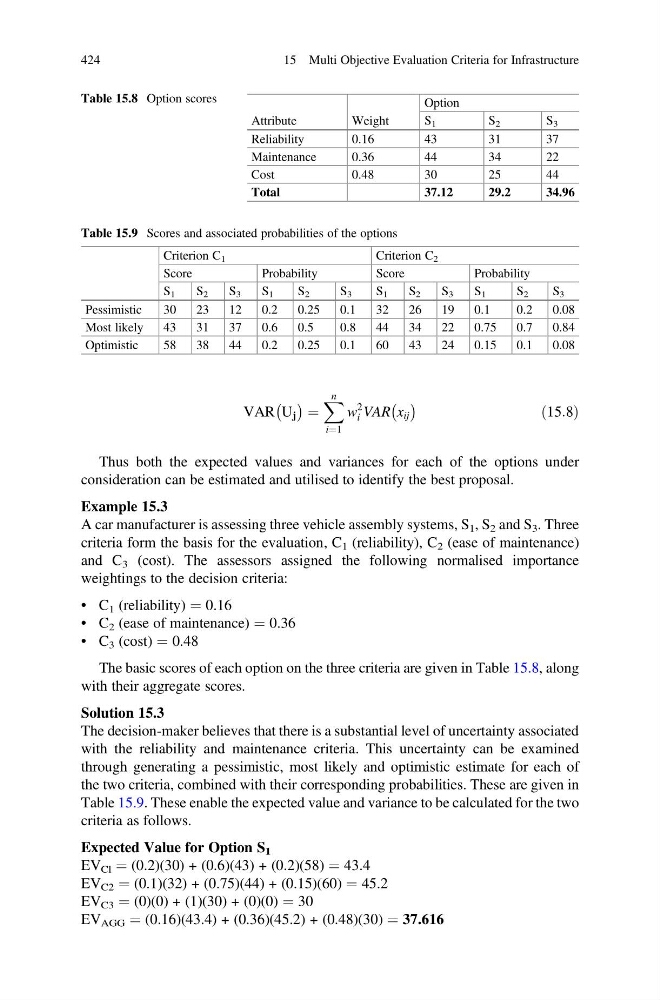
The basic scores of each option on the three criteria are given in Table 15.8, along
with their aggregate scores.
Solution 15.3
The decision-maker believes that there is a substantial level of uncertainty associated
with the reliability and maintenance criteria. This uncertainty can be examined
through generating a pessimistic, most likely and optimistic estimate for each of
the two criteria, combined with their corresponding probabilities. These are given in
Table 15.9. These enable the expected value and variance to be calculated for the two
criteria as follows.
Expected Value for Option S 1
EV Cl ¼ (0.2)(30) + (0.6)(43) + (0.2)(58) ¼ 43.4
EV C2 ¼ (0.1)(32) + (0.75)(44) + (0.15)(60) ¼ 45.2
EV C3 ¼ (0)(0) + (1)(30) + (0)(0) ¼ 30
EV AGG ¼ (0.16)(43.4) + (0.36)(45.2) + (0.48)(30) ¼ 37.616
Table 15.8 Option scores
Attribute
Weight
Option
S 1
S 2
S 3
Reliability
0.16
43
31
37
Maintenance
0.36
44
34
22
Cost
0.48
30
25
44
Total
37.12
29.2
34.96
Table 15.9 Scores and associated probabilities of the options
Criterion C 1
Criterion C 2
Score
Probability
Score
Probability
S 1
S 2
S 3
S 1
S 2
S 3
S 1
S 2
S 3
S 1
S 2
S 3
Pessimistic
30
23
12
0.2
0.25
0.1
32
26
19
0.1
0.2
0.08
Most likely
43
31
37
0.6
0.5
0.8
44
34
22
0.75
0.7
0.84
Optimistic
58
38
44
0.2
0.25
0.1
60
43
24
0.15
0.1
0.08
424
15 Multi Objective Evaluation Criteria for Infrastructure
À Á ¼
X n
i¼1
w
2
i VAR x ij
À Á
ð15:8Þ
Thus both the expected values and variances for each of the options under
consideration can be estimated and utilised to identify the best proposal.
Example 15.3
A car manufacturer is assessing three vehicle assembly systems, S 1 , S 2 and S 3 . Three
criteria form the basis for the evaluation, C 1 (reliability), C 2 (ease of maintenance)
and C 3 (cost). The assessors assigned the following normalised importance
weightings to the decision criteria:
• C 1 (reliability) ¼ 0.16
• C 2 (ease of maintenance) ¼ 0.36
• C 3 (cost) ¼ 0.48
The basic scores of each option on the three criteria are given in Table 15.8, along
with their aggregate scores.
Solution 15.3
The decision-maker believes that there is a substantial level of uncertainty associated
with the reliability and maintenance criteria. This uncertainty can be examined
through generating a pessimistic, most likely and optimistic estimate for each of
the two criteria, combined with their corresponding probabilities. These are given in
Table 15.9. These enable the expected value and variance to be calculated for the two
criteria as follows.
Expected Value for Option S 1
EV Cl ¼ (0.2)(30) + (0.6)(43) + (0.2)(58) ¼ 43.4
EV C2 ¼ (0.1)(32) + (0.75)(44) + (0.15)(60) ¼ 45.2
EV C3 ¼ (0)(0) + (1)(30) + (0)(0) ¼ 30
EV AGG ¼ (0.16)(43.4) + (0.36)(45.2) + (0.48)(30) ¼ 37.616
Table 15.8 Option scores
Attribute
Weight
Option
S 1
S 2
S 3
Reliability
0.16
43
31
37
Maintenance
0.36
44
34
22
Cost
0.48
30
25
44
Total
37.12
29.2
34.96
Table 15.9 Scores and associated probabilities of the options
Criterion C 1
Criterion C 2
Score
Probability
Score
Probability
S 1
S 2
S 3
S 1
S 2
S 3
S 1
S 2
S 3
S 1
S 2
S 3
Pessimistic
30
23
12
0.2
0.25
0.1
32
26
19
0.1
0.2
0.08
Most likely
43
31
37
0.6
0.5
0.8
44
34
22
0.75
0.7
0.84
Optimistic
58
38
44
0.2
0.25
0.1
60
43
24
0.15
0.1
0.08
424
15 Multi Objective Evaluation Criteria for Infrastructure