

examination. The best raw score in each case is assigned a 10-rating. In the case of
cost and mass, lowest is best; with all others, highest is best.
Take the cost criterion. The best score is for Option 2 (Rs. 550,000). This is
assigned a 10 rating, with the other two being assigned the following ratings:
Rating( Option 1 ) ¼ (550,000) Ä (900,000) Â 10 ¼ 6.1
Rating( Option 3 ) ¼ (550,000) Ä (750,000) Â 10 ¼ 7.1
The same process is used to derive the ratings for mass.
For the reliability criterion, the best score is for Option 1 (95%). This is assigned
the 10 rating, with the other ratings as follows:
Rating( Option 2 ) ¼ (80) Ä (95) Â 10 ¼ 8.4
Rating( Option 3 ) ¼ (88) Ä (95) Â 10 ¼ 9.3
Safety and appearance need no conversion as they are already scored on a
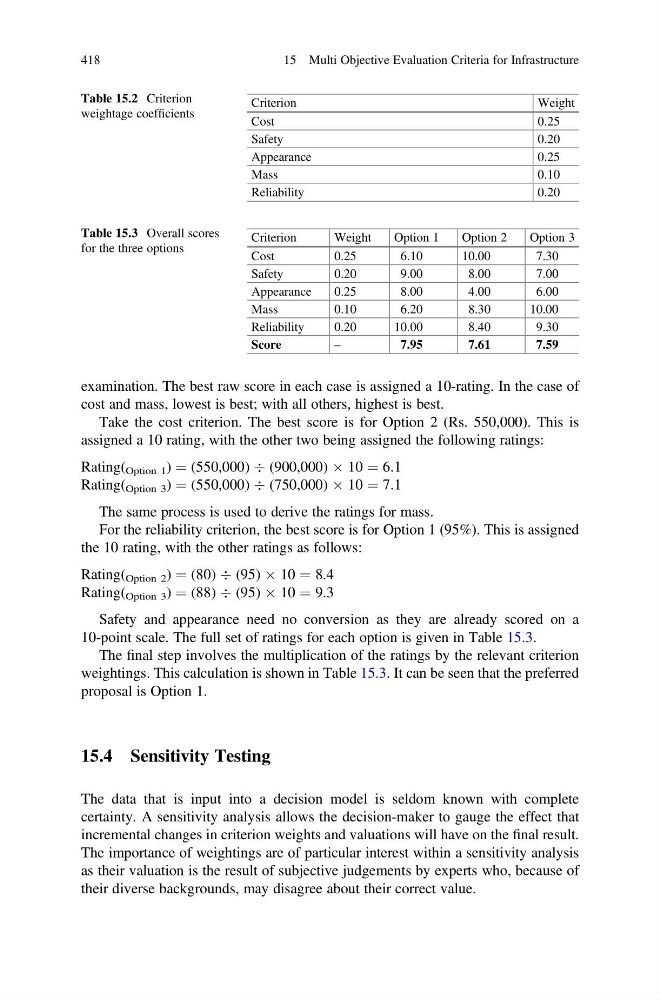
10-point scale. The full set of ratings for each option is given in Table 15.3.
The final step involves the multiplication of the ratings by the relevant criterion
weightings. This calculation is shown in Table 15.3. It can be seen that the preferred
proposal is Option 1.
15.4 Sensitivity Testing
The data that is input into a decision model is seldom known with complete
certainty. A sensitivity analysis allows the decision-maker to gauge the effect that
incremental changes in criterion weights and valuations will have on the final result.
The importance of weightings are of particular interest within a sensitivity analysis
as their valuation is the result of subjective judgements by experts who, because of
their diverse backgrounds, may disagree about their correct value.
Table 15.2 Criterion
weightage coefficients
Criterion
Weight
Cost
0.25
Safety
0.20
Appearance
0.25
Mass
0.10
Reliability
0.20
Table 15.3 Overall scores
for the three options
Criterion
Weight
Option 1
Option 2
Option 3
Cost
0.25
6.10
10.00
7.30
Safety
0.20
9.00
8.00
7.00
Appearance
0.25
8.00
4.00
6.00
Mass
0.10
6.20
8.30
10.00
Reliability
0.20
10.00
8.40
9.30
Score
–
7.95
7.61
7.59
418
15 Multi Objective Evaluation Criteria for Infrastructure
cost and mass, lowest is best; with all others, highest is best.
Take the cost criterion. The best score is for Option 2 (Rs. 550,000). This is
assigned a 10 rating, with the other two being assigned the following ratings:
Rating( Option 1 ) ¼ (550,000) Ä (900,000) Â 10 ¼ 6.1
Rating( Option 3 ) ¼ (550,000) Ä (750,000) Â 10 ¼ 7.1
The same process is used to derive the ratings for mass.
For the reliability criterion, the best score is for Option 1 (95%). This is assigned
the 10 rating, with the other ratings as follows:
Rating( Option 2 ) ¼ (80) Ä (95) Â 10 ¼ 8.4
Rating( Option 3 ) ¼ (88) Ä (95) Â 10 ¼ 9.3
Safety and appearance need no conversion as they are already scored on a
10-point scale. The full set of ratings for each option is given in Table 15.3.
The final step involves the multiplication of the ratings by the relevant criterion
weightings. This calculation is shown in Table 15.3. It can be seen that the preferred
proposal is Option 1.
15.4 Sensitivity Testing
The data that is input into a decision model is seldom known with complete
certainty. A sensitivity analysis allows the decision-maker to gauge the effect that
incremental changes in criterion weights and valuations will have on the final result.
The importance of weightings are of particular interest within a sensitivity analysis
as their valuation is the result of subjective judgements by experts who, because of
their diverse backgrounds, may disagree about their correct value.
Table 15.2 Criterion
weightage coefficients
Criterion
Weight
Cost
0.25
Safety
0.20
Appearance
0.25
Mass
0.10
Reliability
0.20
Table 15.3 Overall scores
for the three options
Criterion
Weight
Option 1
Option 2
Option 3
Cost
0.25
6.10
10.00
7.30
Safety
0.20
9.00
8.00
7.00
Appearance
0.25
8.00
4.00
6.00
Mass
0.10
6.20
8.30
10.00
Reliability
0.20
10.00
8.40
9.30
Score
–
7.95
7.61
7.59
418
15 Multi Objective Evaluation Criteria for Infrastructure