

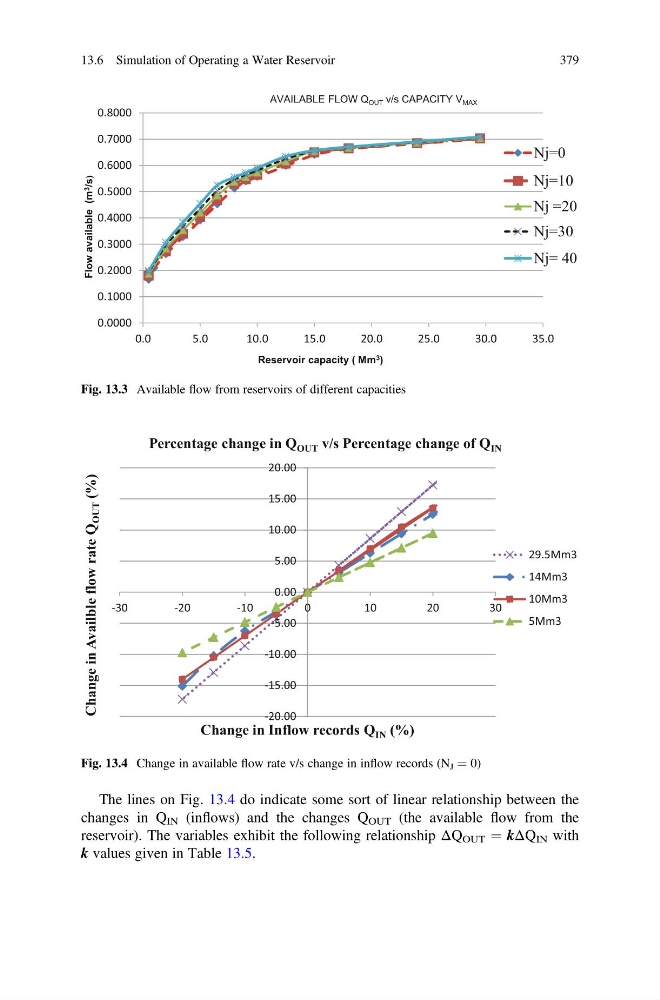
The lines on Fig. 13.4 do indicate some sort of linear relationship between the
changes in Q IN (inflows) and the changes Q OUT (the available flow from the
reservoir). The variables exhibit the following relationship ΔQ OUT ¼ kΔQ IN with
k values given in Table 13.5.
0.0000
0.1000
0.2000
0.3000
0.4000
0.5000
0.6000
0.7000
0.8000
0.0
5.0
10.0
15.0
20.0
25.0
30.0
35.0
Flow available (m 3
/s)
Reservoir capacity ( Mm 3 )
AVAILABLE FLOW Q OUT v/s CAPACITY V MAX
Nj=0
Nj=10
Nj =20
Nj=30
Nj= 40
Fig. 13.3 Available flow from reservoirs of different capacities
-20.00
-15.00
-10.00
-5.00
0.00
5.00
10.00
15.00
20.00
-30
-20
-10
0
10
20
30
Change in Availble flow rate Q
OUT (%)
Change in Inflow records Q IN (%)
Percentage change in Q OUT v/s Percentage change of Q IN
29.5Mm3
14Mm3
10Mm3
5Mm3
Fig. 13.4 Change in available flow rate v/s change in inflow records (N J ¼ 0)
13.6 Simulation of Operating a Water Reservoir
379
changes in Q IN (inflows) and the changes Q OUT (the available flow from the
reservoir). The variables exhibit the following relationship ΔQ OUT ¼ kΔQ IN with
k values given in Table 13.5.
0.0000
0.1000
0.2000
0.3000
0.4000
0.5000
0.6000
0.7000
0.8000
0.0
5.0
10.0
15.0
20.0
25.0
30.0
35.0
Flow available (m 3
/s)
Reservoir capacity ( Mm 3 )
AVAILABLE FLOW Q OUT v/s CAPACITY V MAX
Nj=0
Nj=10
Nj =20
Nj=30
Nj= 40
Fig. 13.3 Available flow from reservoirs of different capacities
-20.00
-15.00
-10.00
-5.00
0.00
5.00
10.00
15.00
20.00
-30
-20
-10
0
10
20
30
Change in Availble flow rate Q
OUT (%)
Change in Inflow records Q IN (%)
Percentage change in Q OUT v/s Percentage change of Q IN
29.5Mm3
14Mm3
10Mm3
5Mm3
Fig. 13.4 Change in available flow rate v/s change in inflow records (N J ¼ 0)
13.6 Simulation of Operating a Water Reservoir
379