

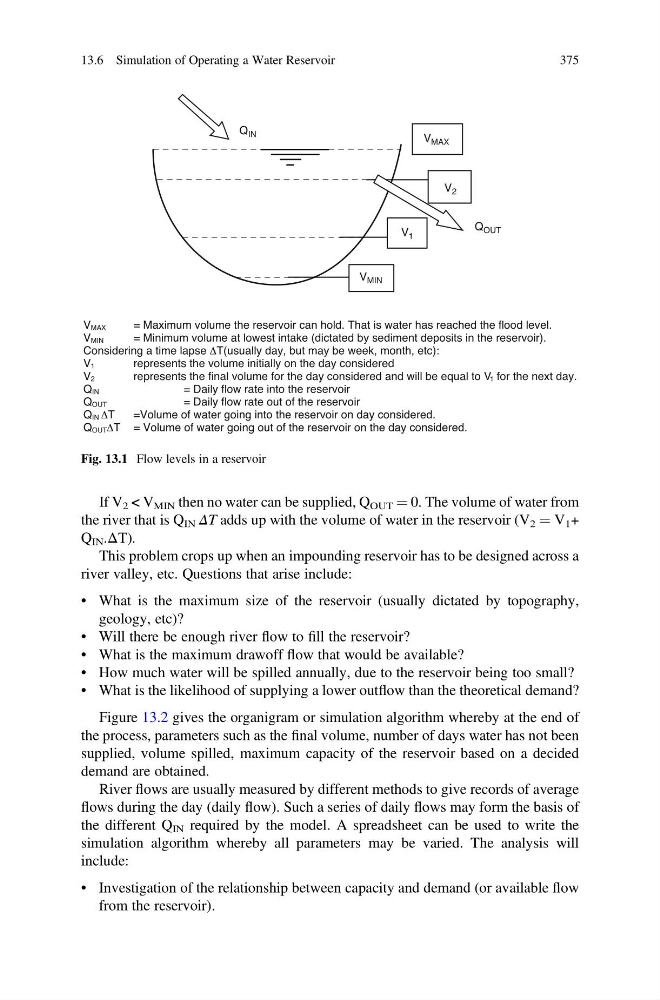
If V 2 < V MIN then no water can be supplied, Q OUT ¼ 0. The volume of water from
the river that is Q IN ΔT adds up with the volume of water in the reservoir (V 2 ¼ V 1 +
Q IN .ΔT).
This problem crops up when an impounding reservoir has to be designed across a
river valley, etc. Questions that arise include:
• What is the maximum size of the reservoir (usually dictated by topography,
geology, etc)?
• Will there be enough river flow to fill the reservoir?
• What is the maximum drawoff flow that would be available?
• How much water will be spilled annually, due to the reservoir being too small?
• What is the likelihood of supplying a lower outflow than the theoretical demand?
Figure 13.2 gives the organigram or simulation algorithm whereby at the end of
the process, parameters such as the final volume, number of days water has not been
supplied, volume spilled, maximum capacity of the reservoir based on a decided
demand are obtained.
River flows are usually measured by different methods to give records of average
flows during the day (daily flow). Such a series of daily flows may form the basis of
the different Q IN required by the model. A spreadsheet can be used to write the
simulation algorithm whereby all parameters may be varied. The analysis will
include:
• Investigation of the relationship between capacity and demand (or available flow
from the reservoir).
VMAX
= Maximum volume the reservoir can hold. That is water has reached the flood level.
V MAX
V 2
Q IN
Q OUT
V MIN
V 1
VMIN
= Minimum volume at lowest intake (dictated by sediment deposits in the reservoir).
Considering a time lapse ΔT(usually day, but may be week, month, etc):
V1
represents the volume initially on the day considered
V2
represents the final volume for the day considered and will be equal to V1 for the next day.
QIN
= Daily flow rate into the reservoir
QOUT
= Daily flow rate out of the reservoir
QIN ΔT
=Volume of water going into the reservoir on day considered.
QOUTΔT = Volume of water going out of the reservoir on the day considered.
Fig. 13.1 Flow levels in a reservoir
13.6 Simulation of Operating a Water Reservoir
375
the river that is Q IN ΔT adds up with the volume of water in the reservoir (V 2 ¼ V 1 +
Q IN .ΔT).
This problem crops up when an impounding reservoir has to be designed across a
river valley, etc. Questions that arise include:
• What is the maximum size of the reservoir (usually dictated by topography,
geology, etc)?
• Will there be enough river flow to fill the reservoir?
• What is the maximum drawoff flow that would be available?
• How much water will be spilled annually, due to the reservoir being too small?
• What is the likelihood of supplying a lower outflow than the theoretical demand?
Figure 13.2 gives the organigram or simulation algorithm whereby at the end of
the process, parameters such as the final volume, number of days water has not been
supplied, volume spilled, maximum capacity of the reservoir based on a decided
demand are obtained.
River flows are usually measured by different methods to give records of average
flows during the day (daily flow). Such a series of daily flows may form the basis of
the different Q IN required by the model. A spreadsheet can be used to write the
simulation algorithm whereby all parameters may be varied. The analysis will
include:
• Investigation of the relationship between capacity and demand (or available flow
from the reservoir).
VMAX
= Maximum volume the reservoir can hold. That is water has reached the flood level.
V MAX
V 2
Q IN
Q OUT
V MIN
V 1
VMIN
= Minimum volume at lowest intake (dictated by sediment deposits in the reservoir).
Considering a time lapse ΔT(usually day, but may be week, month, etc):
V1
represents the volume initially on the day considered
V2
represents the final volume for the day considered and will be equal to V1 for the next day.
QIN
= Daily flow rate into the reservoir
QOUT
= Daily flow rate out of the reservoir
QIN ΔT
=Volume of water going into the reservoir on day considered.
QOUTΔT = Volume of water going out of the reservoir on the day considered.
Fig. 13.1 Flow levels in a reservoir
13.6 Simulation of Operating a Water Reservoir
375