

2. Mathematical models apply only to some particular categories of problems.
3. There is often a resistance from the employees to the new proposals, arising from
a new field.
4. Management, accustomed to conventional thinking, may be the first to resist the
recommendations.
5. The decision cannot depend solely on quantitative considerations, but must
consider the weaknesses of human relationships. Thus, further to being a pure
scientist, the analyst should learn to be tactful and acquire the art of getting the
decisions implemented, something achievable through experience and some
training in social sciences, particularly psychology.
6. Factors such as goodwill, attitude, expectations, etc. cannot be quantified. Hence
the solution ignores all such factors which are important but cannot to be
expressed in quantifiable terms. This lack encourages managers to look upon
modelling as a “theoretical solution” without providing it a fair chance to
demonstrate its worthiness, which also reinforces the natural tendency to resist
changes.
7. Modelling deals with only with a finite number of variables, though in actual
practice, there many more variables influencing the input, the processor and
consequently the output.
8. Although in practice a large number of constraints exist, modelling can solve
problems having only a limited number of constraints.
9. Modelling tries to deal with only one objective function, though in practice, there
may be quite a number of objective functions.
13.6 Simulation of Operating a Water Reservoir
The following example explains the modelling of the operations of filling and
emptying a water reservoir. Such a reservoir receives water from a river usually,
stores it, while also sending some water to the filter works for distribution. This
operation is carried out continuously during many years. However, constructing a
small reservoir will not really serve its intended purpose, while the construction of
too big a reservoir will have spent money unnecessarily.
Consider Fig. 13.1 which shows a schematic diagram of an impounding reservoir.
If a river is feeding the reservoir with a flow rate Q IN and supplying an output flow
rate of Q OUT , the net flow rate will be equal to Q IN -Q OUT (refer to Fig. 13.1).
If the reservoir contains an initial volume of water V 1 , the volume of water added
to the reservoir during the period ΔT is (Q IN -Q OUT ).ΔT. The volume V 2 in the
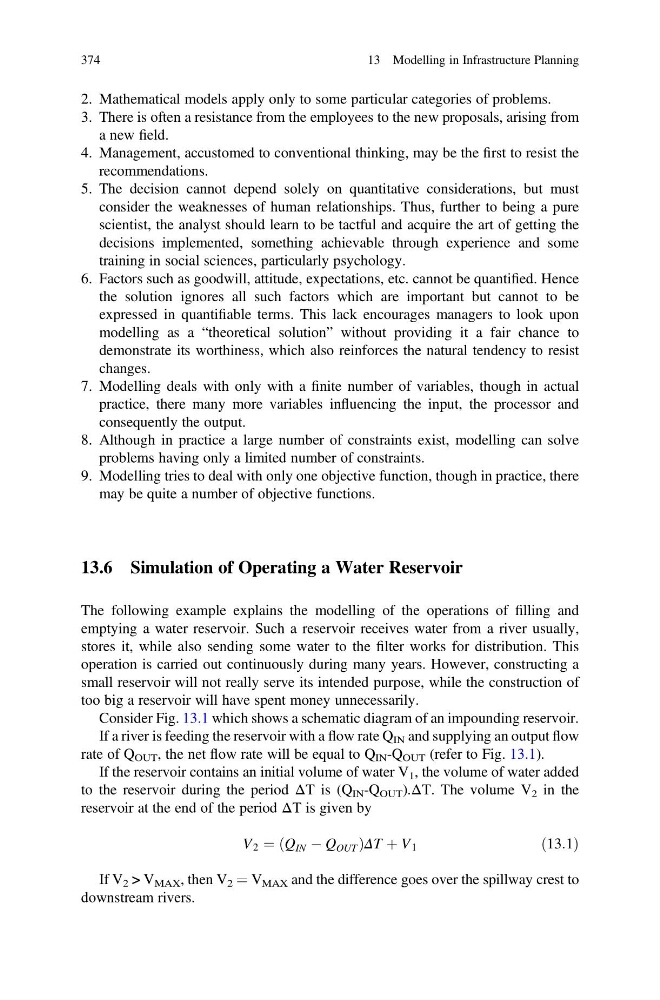
reservoir at the end of the period ΔT is given by
V 2 ¼ Q IN À Q OUT
ð
Þ ΔT þ V 1
ð13:1Þ
If V 2 > V MAX , then V 2 ¼ V MAX and the difference goes over the spillway crest to
downstream rivers.
374
13 Modelling in Infrastructure Planning
3. There is often a resistance from the employees to the new proposals, arising from
a new field.
4. Management, accustomed to conventional thinking, may be the first to resist the
recommendations.
5. The decision cannot depend solely on quantitative considerations, but must
consider the weaknesses of human relationships. Thus, further to being a pure
scientist, the analyst should learn to be tactful and acquire the art of getting the
decisions implemented, something achievable through experience and some
training in social sciences, particularly psychology.
6. Factors such as goodwill, attitude, expectations, etc. cannot be quantified. Hence
the solution ignores all such factors which are important but cannot to be
expressed in quantifiable terms. This lack encourages managers to look upon
modelling as a “theoretical solution” without providing it a fair chance to
demonstrate its worthiness, which also reinforces the natural tendency to resist
changes.
7. Modelling deals with only with a finite number of variables, though in actual
practice, there many more variables influencing the input, the processor and
consequently the output.
8. Although in practice a large number of constraints exist, modelling can solve
problems having only a limited number of constraints.
9. Modelling tries to deal with only one objective function, though in practice, there
may be quite a number of objective functions.
13.6 Simulation of Operating a Water Reservoir
The following example explains the modelling of the operations of filling and
emptying a water reservoir. Such a reservoir receives water from a river usually,
stores it, while also sending some water to the filter works for distribution. This
operation is carried out continuously during many years. However, constructing a
small reservoir will not really serve its intended purpose, while the construction of
too big a reservoir will have spent money unnecessarily.
Consider Fig. 13.1 which shows a schematic diagram of an impounding reservoir.
If a river is feeding the reservoir with a flow rate Q IN and supplying an output flow
rate of Q OUT , the net flow rate will be equal to Q IN -Q OUT (refer to Fig. 13.1).
If the reservoir contains an initial volume of water V 1 , the volume of water added
to the reservoir during the period ΔT is (Q IN -Q OUT ).ΔT. The volume V 2 in the
reservoir at the end of the period ΔT is given by
V 2 ¼ Q IN À Q OUT
ð
Þ ΔT þ V 1
ð13:1Þ
If V 2 > V MAX , then V 2 ¼ V MAX and the difference goes over the spillway crest to
downstream rivers.
374
13 Modelling in Infrastructure Planning