

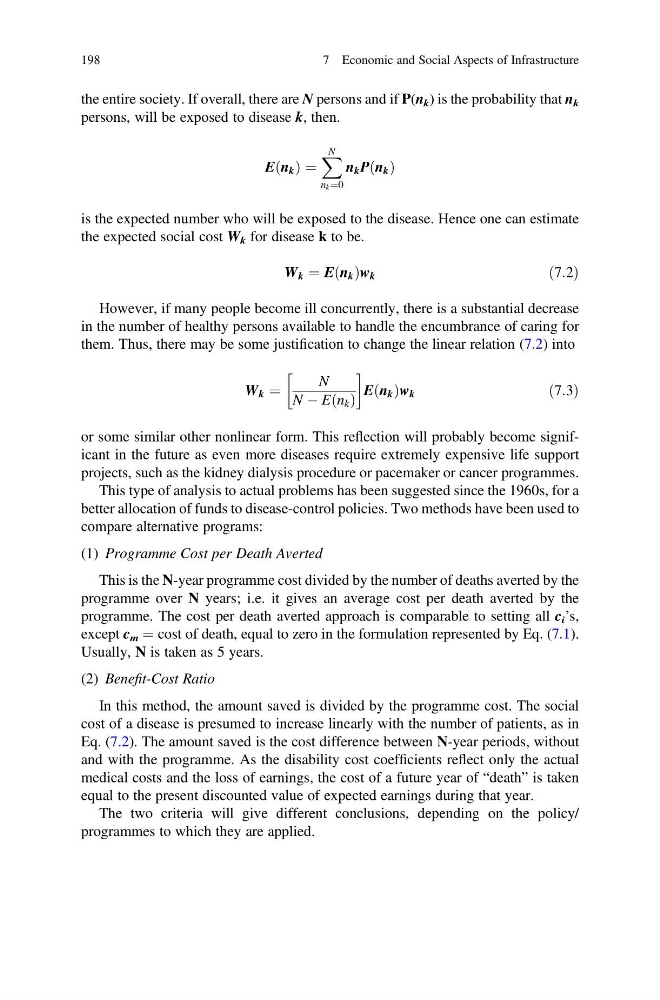
the entire society. If overall, there are N persons and if P(n k ) is the probability that n k
persons, will be exposed to disease k, then.
E n k
ð Þ ¼
X N
n k ¼0
n k P n k
ð Þ
is the expected number who will be exposed to the disease. Hence one can estimate
the expected social cost W k for disease k to be.
W k ¼ E n k
ð Þw k
ð7:2Þ
However, if many people become ill concurrently, there is a substantial decrease
in the number of healthy persons available to handle the encumbrance of caring for
them. Thus, there may be some justification to change the linear relation (7.2) into
W k ¼
N
N À E n k
ð Þ
E n k
ð Þw k
ð7:3Þ
or some similar other nonlinear form. This reflection will probably become significant in the future as even more diseases require extremely expensive life support
projects, such as the kidney dialysis procedure or pacemaker or cancer programmes.
This type of analysis to actual problems has been suggested since the 1960s, for a
better allocation of funds to disease-control policies. Two methods have been used to
compare alternative programs:
(1) Programme Cost per Death Averted
This is the N-year programme cost divided by the number of deaths averted by the
programme over N years; i.e. it gives an average cost per death averted by the
programme. The cost per death averted approach is comparable to setting all c i ’s,
except c m ¼ cost of death, equal to zero in the formulation represented by Eq. (7.1).
Usually, N is taken as 5 years.
(2) Benefit-Cost Ratio
In this method, the amount saved is divided by the programme cost. The social
cost of a disease is presumed to increase linearly with the number of patients, as in
Eq. (7.2). The amount saved is the cost difference between N-year periods, without
and with the programme. As the disability cost coefficients reflect only the actual
medical costs and the loss of earnings, the cost of a future year of “death” is taken
equal to the present discounted value of expected earnings during that year.
The two criteria will give different conclusions, depending on the policy/
programmes to which they are applied.
198
7 Economic and Social Aspects of Infrastructure
persons, will be exposed to disease k, then.
E n k
ð Þ ¼
X N
n k ¼0
n k P n k
ð Þ
is the expected number who will be exposed to the disease. Hence one can estimate
the expected social cost W k for disease k to be.
W k ¼ E n k
ð Þw k
ð7:2Þ
However, if many people become ill concurrently, there is a substantial decrease
in the number of healthy persons available to handle the encumbrance of caring for
them. Thus, there may be some justification to change the linear relation (7.2) into
W k ¼
N
N À E n k
ð Þ
E n k
ð Þw k
ð7:3Þ
or some similar other nonlinear form. This reflection will probably become significant in the future as even more diseases require extremely expensive life support
projects, such as the kidney dialysis procedure or pacemaker or cancer programmes.
This type of analysis to actual problems has been suggested since the 1960s, for a
better allocation of funds to disease-control policies. Two methods have been used to
compare alternative programs:
(1) Programme Cost per Death Averted
This is the N-year programme cost divided by the number of deaths averted by the
programme over N years; i.e. it gives an average cost per death averted by the
programme. The cost per death averted approach is comparable to setting all c i ’s,
except c m ¼ cost of death, equal to zero in the formulation represented by Eq. (7.1).
Usually, N is taken as 5 years.
(2) Benefit-Cost Ratio
In this method, the amount saved is divided by the programme cost. The social
cost of a disease is presumed to increase linearly with the number of patients, as in
Eq. (7.2). The amount saved is the cost difference between N-year periods, without
and with the programme. As the disability cost coefficients reflect only the actual
medical costs and the loss of earnings, the cost of a future year of “death” is taken
equal to the present discounted value of expected earnings during that year.
The two criteria will give different conclusions, depending on the policy/
programmes to which they are applied.
198
7 Economic and Social Aspects of Infrastructure