

gives a period of 28 years between pre-feasibility and actual supply, when a dam
(Baptiste-Guibies scheme) for the area serviced was imagined as long back as 1974!
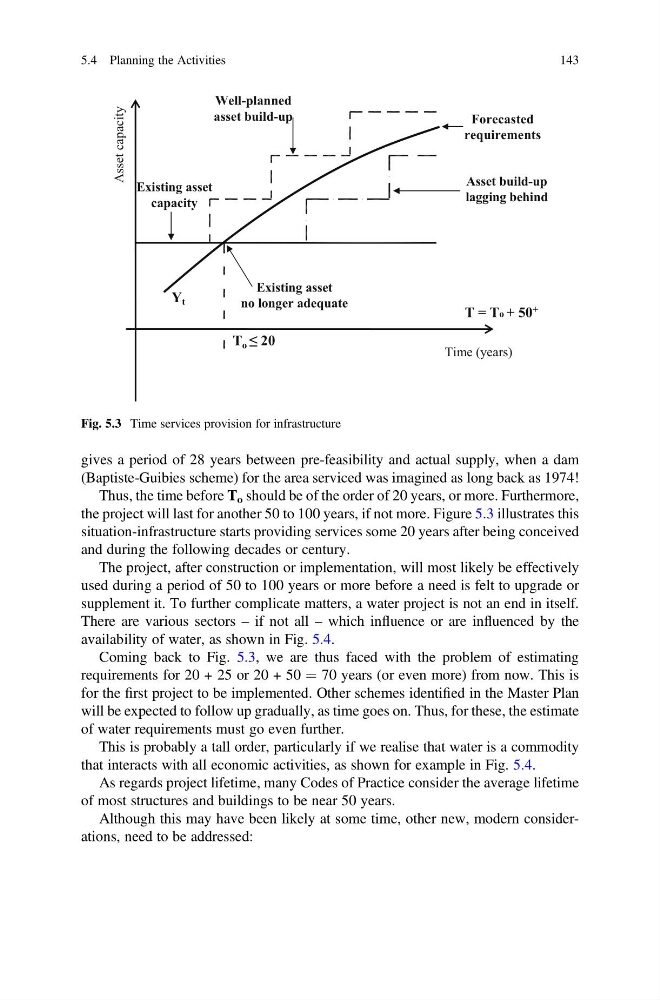
Thus, the time before T o should be of the order of 20 years, or more. Furthermore,
the project will last for another 50 to 100 years, if not more. Figure 5.3 illustrates this
situation-infrastructure starts providing services some 20 years after being conceived
and during the following decades or century.
The project, after construction or implementation, will most likely be effectively
used during a period of 50 to 100 years or more before a need is felt to upgrade or
supplement it. To further complicate matters, a water project is not an end in itself.
There are various sectors – if not all – which influence or are influenced by the
availability of water, as shown in Fig. 5.4.
Coming back to Fig. 5.3, we are thus faced with the problem of estimating
requirements for 20 + 25 or 20 + 50 ¼ 70 years (or even more) from now. This is
for the first project to be implemented. Other schemes identified in the Master Plan
will be expected to follow up gradually, as time goes on. Thus, for these, the estimate
of water requirements must go even further.
This is probably a tall order, particularly if we realise that water is a commodity
that interacts with all economic activities, as shown for example in Fig. 5.4.
As regards project lifetime, many Codes of Practice consider the average lifetime
of most structures and buildings to be near 50 years.
Although this may have been likely at some time, other new, modern considerations, need to be addressed:
Well-planned
asset build-up
Forecasted
requirements
Existing asset
capacity
Asset build-up
lagging behind
Existing asset
no longer adequate
Time (years)
Asset capacity
Y t
T o ≤ 20
T = To + 50 +
Fig. 5.3 Time services provision for infrastructure
5.4 Planning the Activities
143
(Baptiste-Guibies scheme) for the area serviced was imagined as long back as 1974!
Thus, the time before T o should be of the order of 20 years, or more. Furthermore,
the project will last for another 50 to 100 years, if not more. Figure 5.3 illustrates this
situation-infrastructure starts providing services some 20 years after being conceived
and during the following decades or century.
The project, after construction or implementation, will most likely be effectively
used during a period of 50 to 100 years or more before a need is felt to upgrade or
supplement it. To further complicate matters, a water project is not an end in itself.
There are various sectors – if not all – which influence or are influenced by the
availability of water, as shown in Fig. 5.4.
Coming back to Fig. 5.3, we are thus faced with the problem of estimating
requirements for 20 + 25 or 20 + 50 ¼ 70 years (or even more) from now. This is
for the first project to be implemented. Other schemes identified in the Master Plan
will be expected to follow up gradually, as time goes on. Thus, for these, the estimate
of water requirements must go even further.
This is probably a tall order, particularly if we realise that water is a commodity
that interacts with all economic activities, as shown for example in Fig. 5.4.
As regards project lifetime, many Codes of Practice consider the average lifetime
of most structures and buildings to be near 50 years.
Although this may have been likely at some time, other new, modern considerations, need to be addressed:
Well-planned
asset build-up
Forecasted
requirements
Existing asset
capacity
Asset build-up
lagging behind
Existing asset
no longer adequate
Time (years)
Asset capacity
Y t
T o ≤ 20
T = To + 50 +
Fig. 5.3 Time services provision for infrastructure
5.4 Planning the Activities
143