

68
A. Shah
3.6.2 Typical Examples
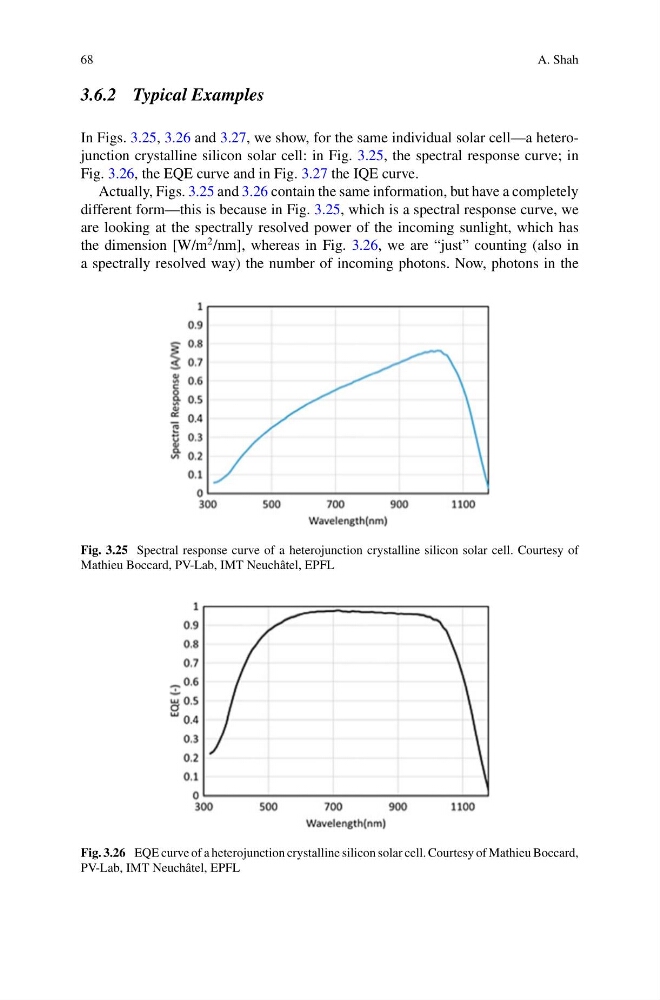
In Figs. 3.25, 3.26 and 3.27, we show, for the same individual solar cell—a heterojunction crystalline silicon solar cell: in Fig. 3.25, the spectral response curve; in
Fig. 3.26, the EQE curve and in Fig. 3.27 the IQE curve.
Actually, Figs. 3.25 and 3.26 contain the same information, but have a completely
different form—this is because in Fig. 3.25, which is a spectral response curve, we
are looking at the spectrally resolved power of the incoming sunlight, which has
the dimension [W/m
2 /nm], whereas in Fig. 3.26, we are “just” counting (also in
a spectrally resolved way) the number of incoming photons. Now, photons in the
Fig. 3.25 Spectral response curve of a heterojunction crystalline silicon solar cell. Courtesy of
Mathieu Boccard, PV-Lab, IMT Neuchâtel, EPFL
Fig. 3.26 EQE curve of a heterojunction crystalline silicon solar cell. Courtesy of Mathieu Boccard,
PV-Lab, IMT Neuchâtel, EPFL
A. Shah
3.6.2 Typical Examples
In Figs. 3.25, 3.26 and 3.27, we show, for the same individual solar cell—a heterojunction crystalline silicon solar cell: in Fig. 3.25, the spectral response curve; in
Fig. 3.26, the EQE curve and in Fig. 3.27 the IQE curve.
Actually, Figs. 3.25 and 3.26 contain the same information, but have a completely
different form—this is because in Fig. 3.25, which is a spectral response curve, we
are looking at the spectrally resolved power of the incoming sunlight, which has
the dimension [W/m
2 /nm], whereas in Fig. 3.26, we are “just” counting (also in
a spectrally resolved way) the number of incoming photons. Now, photons in the
Fig. 3.25 Spectral response curve of a heterojunction crystalline silicon solar cell. Courtesy of
Mathieu Boccard, PV-Lab, IMT Neuchâtel, EPFL
Fig. 3.26 EQE curve of a heterojunction crystalline silicon solar cell. Courtesy of Mathieu Boccard,
PV-Lab, IMT Neuchâtel, EPFL