

3 Solar Cells: Basics
43
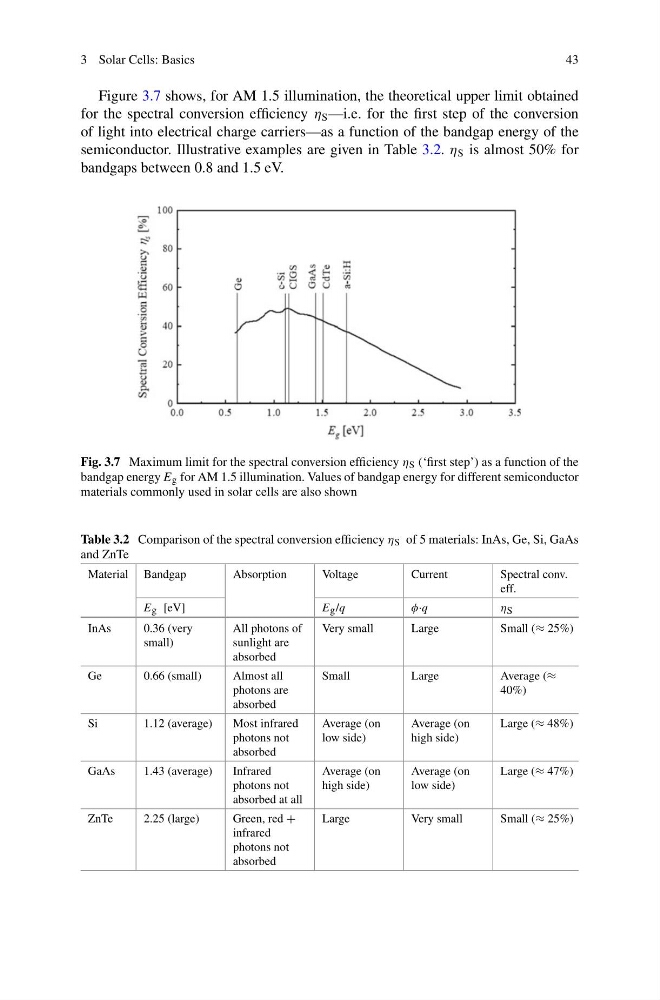
Figure 3.7 shows, for AM 1.5 illumination, the theoretical upper limit obtained
for the spectral conversion efficiency η S —i.e. for the first step of the conversion
of light into electrical charge carriers—as a function of the bandgap energy of the
semiconductor. Illustrative examples are given in Table 3.2. η S is almost 50% for
bandgaps between 0.8 and 1.5 eV.
Fig. 3.7 Maximum limit for the spectral conversion efficiency η S (‘first step’) as a function of the
bandgap energy E g for AM 1.5 illumination. Values of bandgap energy for different semiconductor
materials commonly used in solar cells are also shown
Table 3.2 Comparison of the spectral conversion efficiency η S of 5 materials: InAs, Ge, Si, GaAs
and ZnTe
Material Bandgap
Absorption
Voltage
Current
Spectral conv.
eff.
E g [eV]
E g /q
φ·q
η S
InAs
0.36 (very
small)
All photons of
sunlight are
absorbed
Very small
Large
Small (≈ 25%)
Ge
0.66 (small)
Almost all
photons are
absorbed
Small
Large
Average (≈
40%)
Si
1.12 (average)
Most infrared
photons not
absorbed
Average (on
low side)
Average (on
high side)
Large (≈ 48%)
GaAs
1.43 (average)
Infrared
photons not
absorbed at all
Average (on
high side)
Average (on
low side)
Large (≈ 47%)
ZnTe
2.25 (large)
Green, red +
infrared
photons not
absorbed
Large
Very small
Small (≈ 25%)
43
Figure 3.7 shows, for AM 1.5 illumination, the theoretical upper limit obtained
for the spectral conversion efficiency η S —i.e. for the first step of the conversion
of light into electrical charge carriers—as a function of the bandgap energy of the
semiconductor. Illustrative examples are given in Table 3.2. η S is almost 50% for
bandgaps between 0.8 and 1.5 eV.
Fig. 3.7 Maximum limit for the spectral conversion efficiency η S (‘first step’) as a function of the
bandgap energy E g for AM 1.5 illumination. Values of bandgap energy for different semiconductor
materials commonly used in solar cells are also shown
Table 3.2 Comparison of the spectral conversion efficiency η S of 5 materials: InAs, Ge, Si, GaAs
and ZnTe
Material Bandgap
Absorption
Voltage
Current
Spectral conv.
eff.
E g [eV]
E g /q
φ·q
η S
InAs
0.36 (very
small)
All photons of
sunlight are
absorbed
Very small
Large
Small (≈ 25%)
Ge
0.66 (small)
Almost all
photons are
absorbed
Small
Large
Average (≈
40%)
Si
1.12 (average)
Most infrared
photons not
absorbed
Average (on
low side)
Average (on
high side)
Large (≈ 48%)
GaAs
1.43 (average)
Infrared
photons not
absorbed at all
Average (on
high side)
Average (on
low side)
Large (≈ 47%)
ZnTe
2.25 (large)
Green, red +
infrared
photons not
absorbed
Large
Very small
Small (≈ 25%)