

42
A. Shah
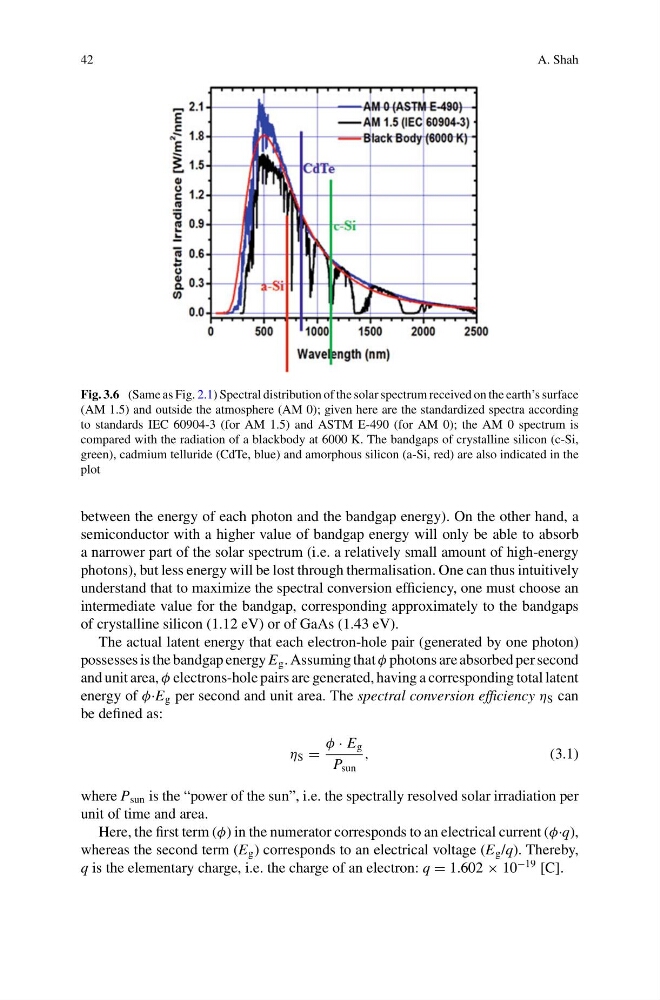
Fig. 3.6 (Same as Fig. 2.1) Spectral distribution of the solar spectrum received on the earth’s surface
(AM 1.5) and outside the atmosphere (AM 0); given here are the standardized spectra according
to standards IEC 60904-3 (for AM 1.5) and ASTM E-490 (for AM 0); the AM 0 spectrum is
compared with the radiation of a blackbody at 6000 K. The bandgaps of crystalline silicon (c-Si,
green), cadmium telluride (CdTe, blue) and amorphous silicon (a-Si, red) are also indicated in the
plot
between the energy of each photon and the bandgap energy). On the other hand, a
semiconductor with a higher value of bandgap energy will only be able to absorb
a narrower part of the solar spectrum (i.e. a relatively small amount of high-energy
photons), but less energy will be lost through thermalisation. One can thus intuitively
understand that to maximize the spectral conversion efficiency, one must choose an
intermediate value for the bandgap, corresponding approximately to the bandgaps
of crystalline silicon (1.12 eV) or of GaAs (1.43 eV).
The actual latent energy that each electron-hole pair (generated by one photon)
possesses is the bandgap energy E g . Assuming that φ photons are absorbed per second
and unit area, φ electrons-hole pairs are generated, having a corresponding total latent
energy of φ·E g per second and unit area. The spectral conversion efficiency η S can
be defined as:
η S =
φ · E g
P sun
,
(3.1)
where P sun is the “power of the sun”, i.e. the spectrally resolved solar irradiation per
unit of time and area.
Here, the first term (φ) in the numerator corresponds to an electrical current (φ·q),
whereas the second term (E g ) corresponds to an electrical voltage (E g /q). Thereby,
q is the elementary charge, i.e. the charge of an electron: q = 1.602 × 10
−19 [C].
A. Shah
Fig. 3.6 (Same as Fig. 2.1) Spectral distribution of the solar spectrum received on the earth’s surface
(AM 1.5) and outside the atmosphere (AM 0); given here are the standardized spectra according
to standards IEC 60904-3 (for AM 1.5) and ASTM E-490 (for AM 0); the AM 0 spectrum is
compared with the radiation of a blackbody at 6000 K. The bandgaps of crystalline silicon (c-Si,
green), cadmium telluride (CdTe, blue) and amorphous silicon (a-Si, red) are also indicated in the
plot
between the energy of each photon and the bandgap energy). On the other hand, a
semiconductor with a higher value of bandgap energy will only be able to absorb
a narrower part of the solar spectrum (i.e. a relatively small amount of high-energy
photons), but less energy will be lost through thermalisation. One can thus intuitively
understand that to maximize the spectral conversion efficiency, one must choose an
intermediate value for the bandgap, corresponding approximately to the bandgaps
of crystalline silicon (1.12 eV) or of GaAs (1.43 eV).
The actual latent energy that each electron-hole pair (generated by one photon)
possesses is the bandgap energy E g . Assuming that φ photons are absorbed per second
and unit area, φ electrons-hole pairs are generated, having a corresponding total latent
energy of φ·E g per second and unit area. The spectral conversion efficiency η S can
be defined as:
η S =
φ · E g
P sun
,
(3.1)
where P sun is the “power of the sun”, i.e. the spectrally resolved solar irradiation per
unit of time and area.
Here, the first term (φ) in the numerator corresponds to an electrical current (φ·q),
whereas the second term (E g ) corresponds to an electrical voltage (E g /q). Thereby,
q is the elementary charge, i.e. the charge of an electron: q = 1.602 × 10
−19 [C].