

334
S. Nowak
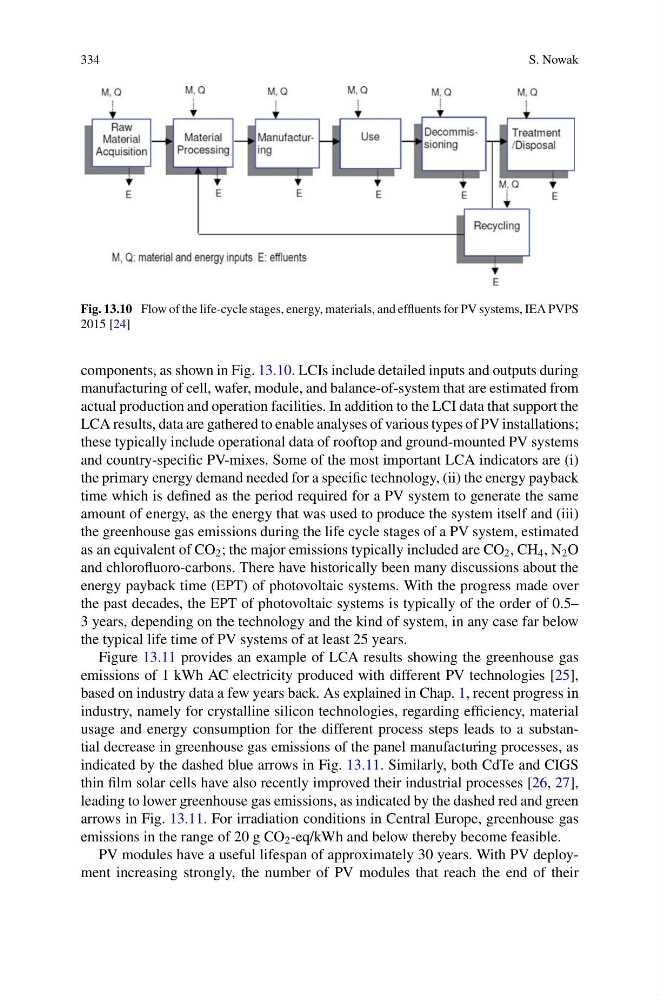
Fig. 13.10 Flow of the life-cycle stages, energy, materials, and effluents for PV systems, IEA PVPS
2015 [24]
components, as shown in Fig. 13.10. LCIs include detailed inputs and outputs during
manufacturing of cell, wafer, module, and balance-of-system that are estimated from
actual production and operation facilities. In addition to the LCI data that support the
LCA results, data are gathered to enable analyses of various types of PV installations;
these typically include operational data of rooftop and ground-mounted PV systems
and country-specific PV-mixes. Some of the most important LCA indicators are (i)
the primary energy demand needed for a specific technology, (ii) the energy payback
time which is defined as the period required for a PV system to generate the same
amount of energy, as the energy that was used to produce the system itself and (iii)
the greenhouse gas emissions during the life cycle stages of a PV system, estimated
as an equivalent of CO 2 ; the major emissions typically included are CO 2 , CH 4 , N 2 O
and chlorofluoro-carbons. There have historically been many discussions about the
energy payback time (EPT) of photovoltaic systems. With the progress made over
the past decades, the EPT of photovoltaic systems is typically of the order of 0.5–
3 years, depending on the technology and the kind of system, in any case far below
the typical life time of PV systems of at least 25 years.
Figure 13.11 provides an example of LCA results showing the greenhouse gas
emissions of 1 kWh AC electricity produced with different PV technologies [25],
based on industry data a few years back. As explained in Chap. 1, recent progress in
industry, namely for crystalline silicon technologies, regarding efficiency, material
usage and energy consumption for the different process steps leads to a substantial decrease in greenhouse gas emissions of the panel manufacturing processes, as
indicated by the dashed blue arrows in Fig. 13.11. Similarly, both CdTe and CIGS
thin film solar cells have also recently improved their industrial processes [26, 27],
leading to lower greenhouse gas emissions, as indicated by the dashed red and green
arrows in Fig. 13.11. For irradiation conditions in Central Europe, greenhouse gas
emissions in the range of 20 g CO 2 -eq/kWh and below thereby become feasible.
PV modules have a useful lifespan of approximately 30 years. With PV deployment increasing strongly, the number of PV modules that reach the end of their
S. Nowak
Fig. 13.10 Flow of the life-cycle stages, energy, materials, and effluents for PV systems, IEA PVPS
2015 [24]
components, as shown in Fig. 13.10. LCIs include detailed inputs and outputs during
manufacturing of cell, wafer, module, and balance-of-system that are estimated from
actual production and operation facilities. In addition to the LCI data that support the
LCA results, data are gathered to enable analyses of various types of PV installations;
these typically include operational data of rooftop and ground-mounted PV systems
and country-specific PV-mixes. Some of the most important LCA indicators are (i)
the primary energy demand needed for a specific technology, (ii) the energy payback
time which is defined as the period required for a PV system to generate the same
amount of energy, as the energy that was used to produce the system itself and (iii)
the greenhouse gas emissions during the life cycle stages of a PV system, estimated
as an equivalent of CO 2 ; the major emissions typically included are CO 2 , CH 4 , N 2 O
and chlorofluoro-carbons. There have historically been many discussions about the
energy payback time (EPT) of photovoltaic systems. With the progress made over
the past decades, the EPT of photovoltaic systems is typically of the order of 0.5–
3 years, depending on the technology and the kind of system, in any case far below
the typical life time of PV systems of at least 25 years.
Figure 13.11 provides an example of LCA results showing the greenhouse gas
emissions of 1 kWh AC electricity produced with different PV technologies [25],
based on industry data a few years back. As explained in Chap. 1, recent progress in
industry, namely for crystalline silicon technologies, regarding efficiency, material
usage and energy consumption for the different process steps leads to a substantial decrease in greenhouse gas emissions of the panel manufacturing processes, as
indicated by the dashed blue arrows in Fig. 13.11. Similarly, both CdTe and CIGS
thin film solar cells have also recently improved their industrial processes [26, 27],
leading to lower greenhouse gas emissions, as indicated by the dashed red and green
arrows in Fig. 13.11. For irradiation conditions in Central Europe, greenhouse gas
emissions in the range of 20 g CO 2 -eq/kWh and below thereby become feasible.
PV modules have a useful lifespan of approximately 30 years. With PV deployment increasing strongly, the number of PV modules that reach the end of their