

128
S. Leu and D. Sontag
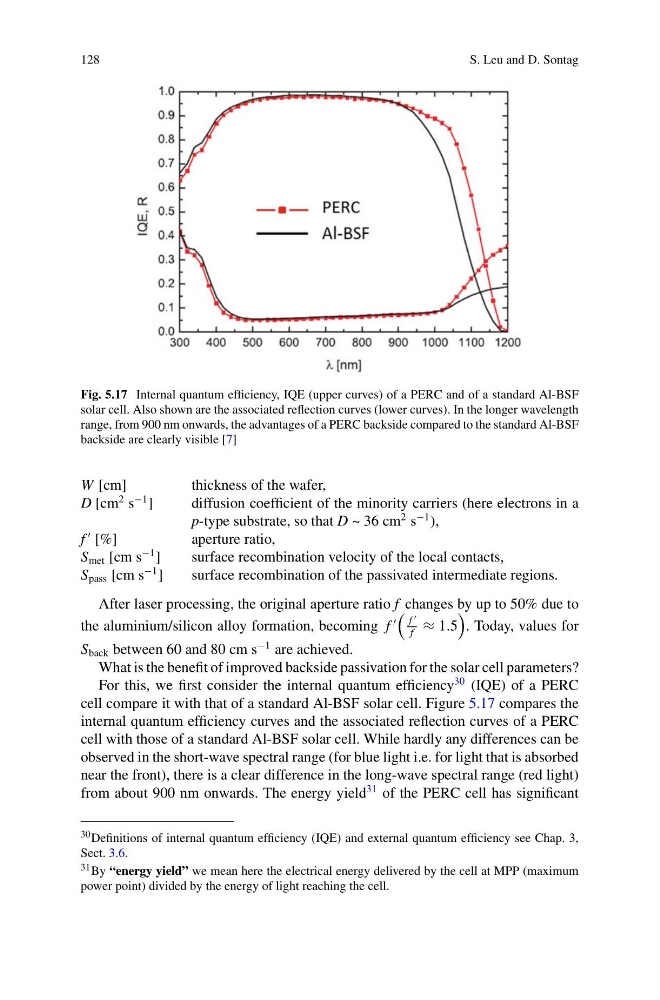
Fig. 5.17 Internal quantum efficiency, IQE (upper curves) of a PERC and of a standard Al-BSF
solar cell. Also shown are the associated reflection curves (lower curves). In the longer wavelength
range, from 900 nm onwards, the advantages of a PERC backside compared to the standard Al-BSF
backside are clearly visible [7]
W [cm]
thickness of the wafer,
D [cm
2 s
−1 ]
diffusion coefficient of the minority carriers (here electrons in a
p-type substrate, so that D ~ 36 cm
2 s
−1 ),
f
[%]
aperture ratio,
S met [cm s
−1 ]
surface recombination velocity of the local contacts,
S pass [cm s
−1 ]
surface recombination of the passivated intermediate regions.
After laser processing, the original aperture ratio f changes by up to 50% due to
the aluminium/silicon alloy formation, becoming f
f
f
≈ 1.5
. Today, values for
S back between 60 and 80 cm s
−1 are achieved.
What is the benefit of improved backside passivation for the solar cell parameters?
For this, we first consider the internal quantum efficiency
30 (IQE) of a PERC
cell compare it with that of a standard Al-BSF solar cell. Figure 5.17 compares the
internal quantum efficiency curves and the associated reflection curves of a PERC
cell with those of a standard Al-BSF solar cell. While hardly any differences can be
observed in the short-wave spectral range (for blue light i.e. for light that is absorbed
near the front), there is a clear difference in the long-wave spectral range (red light)
from about 900 nm onwards. The energy yield
31 of the PERC cell has significant
30 Definitions of internal quantum efficiency (IQE) and external quantum efficiency see Chap. 3,
Sect. 3.6.
31 By “energy yield” we mean here the electrical energy delivered by the cell at MPP (maximum
power point) divided by the energy of light reaching the cell.
S. Leu and D. Sontag
Fig. 5.17 Internal quantum efficiency, IQE (upper curves) of a PERC and of a standard Al-BSF
solar cell. Also shown are the associated reflection curves (lower curves). In the longer wavelength
range, from 900 nm onwards, the advantages of a PERC backside compared to the standard Al-BSF
backside are clearly visible [7]
W [cm]
thickness of the wafer,
D [cm
2 s
−1 ]
diffusion coefficient of the minority carriers (here electrons in a
p-type substrate, so that D ~ 36 cm
2 s
−1 ),
f
[%]
aperture ratio,
S met [cm s
−1 ]
surface recombination velocity of the local contacts,
S pass [cm s
−1 ]
surface recombination of the passivated intermediate regions.
After laser processing, the original aperture ratio f changes by up to 50% due to
the aluminium/silicon alloy formation, becoming f
f
f
≈ 1.5
. Today, values for
S back between 60 and 80 cm s
−1 are achieved.
What is the benefit of improved backside passivation for the solar cell parameters?
For this, we first consider the internal quantum efficiency
30 (IQE) of a PERC
cell compare it with that of a standard Al-BSF solar cell. Figure 5.17 compares the
internal quantum efficiency curves and the associated reflection curves of a PERC
cell with those of a standard Al-BSF solar cell. While hardly any differences can be
observed in the short-wave spectral range (for blue light i.e. for light that is absorbed
near the front), there is a clear difference in the long-wave spectral range (red light)
from about 900 nm onwards. The energy yield
31 of the PERC cell has significant
30 Definitions of internal quantum efficiency (IQE) and external quantum efficiency see Chap. 3,
Sect. 3.6.
31 By “energy yield” we mean here the electrical energy delivered by the cell at MPP (maximum
power point) divided by the energy of light reaching the cell.