

defined in many respects by the lifetime T 1 of carriers on the upper laser operation
level T c % T 1 .
6.7.2 Oscillations Spectrum in the OEO Closed
Feedback Loop
The analog model of the statistical processes in OEO MZ with the utilization of the
traditional correlator of two random quantities is shown in Figs. 5.10, 5.11, and
5.13 (Chap. 5).
At closeness of the feedback loop (switch Sw1 is closed, switch Sw2 is opened in
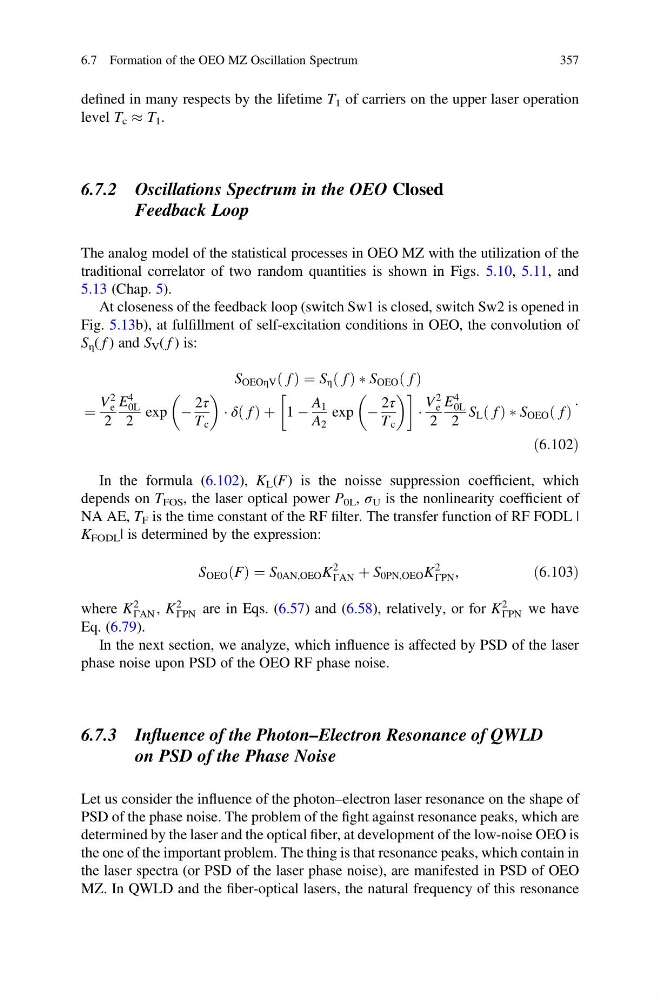
Fig. 5.13b), at fulfillment of self-excitation conditions in OEO, the convolution of
S η ( f ) and S V ( f ) is:
S OEOηV f
ð Þ ¼ S η f
ð Þ Ã S OEO f
ð Þ
¼
V
2
e
2
E
4
0L
2
exp À
2τ
T c
Á δ f
ð Þ þ 1 À
A 1
A 2
exp À
2τ
T c
!
Á
V
2
e
2
E
4
0L
2
S L f
ð Þ Ã S OEO f
ð Þ
:
ð6:102Þ
In the formula (6.102), K L (F) is the noisse suppression coefficient, which
depends on T FOS , the laser optical power P 0L , σ U is the nonlinearity coefficient of
NA AE, T F is the time constant of the RF filter. The transfer function of RF FODL |
K FODL | is determined by the expression:
S OEO F
ð Þ ¼ S 0AN,OEO K
2
ΓAN þ S 0PN,OEO K
2
ΓPN ,
ð6:103Þ
where K
2
ΓAN , K
2
ΓPN are in Eqs. (6.57) and (6.58), relatively, or for K
2
ΓPN we have
Eq. (6.79).
In the next section, we analyze, which influence is affected by PSD of the laser
phase noise upon PSD of the OEO RF phase noise.
6.7.3 Influence of the Photon–Electron Resonance of QWLD
on PSD of the Phase Noise
Let us consider the influence of the photon–electron laser resonance on the shape of
PSD of the phase noise. The problem of the fight against resonance peaks, which are
determined by the laser and the optical fiber, at development of the low-noise OEO is
the one of the important problem. The thing is that resonance peaks, which contain in
the laser spectra (or PSD of the laser phase noise), are manifested in PSD of OEO
MZ. In QWLD and the fiber-optical lasers, the natural frequency of this resonance
6.7 Formation of the OEO MZ Oscillation Spectrum
357
level T c % T 1 .
6.7.2 Oscillations Spectrum in the OEO Closed
Feedback Loop
The analog model of the statistical processes in OEO MZ with the utilization of the
traditional correlator of two random quantities is shown in Figs. 5.10, 5.11, and
5.13 (Chap. 5).
At closeness of the feedback loop (switch Sw1 is closed, switch Sw2 is opened in
Fig. 5.13b), at fulfillment of self-excitation conditions in OEO, the convolution of
S η ( f ) and S V ( f ) is:
S OEOηV f
ð Þ ¼ S η f
ð Þ Ã S OEO f
ð Þ
¼
V
2
e
2
E
4
0L
2
exp À
2τ
T c
Á δ f
ð Þ þ 1 À
A 1
A 2
exp À
2τ
T c
!
Á
V
2
e
2
E
4
0L
2
S L f
ð Þ Ã S OEO f
ð Þ
:
ð6:102Þ
In the formula (6.102), K L (F) is the noisse suppression coefficient, which
depends on T FOS , the laser optical power P 0L , σ U is the nonlinearity coefficient of
NA AE, T F is the time constant of the RF filter. The transfer function of RF FODL |
K FODL | is determined by the expression:
S OEO F
ð Þ ¼ S 0AN,OEO K
2
ΓAN þ S 0PN,OEO K
2
ΓPN ,
ð6:103Þ
where K
2
ΓAN , K
2
ΓPN are in Eqs. (6.57) and (6.58), relatively, or for K
2
ΓPN we have
Eq. (6.79).
In the next section, we analyze, which influence is affected by PSD of the laser
phase noise upon PSD of the OEO RF phase noise.
6.7.3 Influence of the Photon–Electron Resonance of QWLD
on PSD of the Phase Noise
Let us consider the influence of the photon–electron laser resonance on the shape of
PSD of the phase noise. The problem of the fight against resonance peaks, which are
determined by the laser and the optical fiber, at development of the low-noise OEO is
the one of the important problem. The thing is that resonance peaks, which contain in
the laser spectra (or PSD of the laser phase noise), are manifested in PSD of OEO
MZ. In QWLD and the fiber-optical lasers, the natural frequency of this resonance
6.7 Formation of the OEO MZ Oscillation Spectrum
357