

In Fig. 5.16, we see plots of PSD of optical emission after passage through the
MZ modulator in the quadrature and non-quadrature operation modes.
Presented plots in Fig. 5.16 allow the conclusions how are PSD of the laser
emission changing, depending on the chosen mode, or at variation of φ 0MZ in the
formula (Eq. 5.94). The level of PSD of DC component in the “π” mode decreases
minimum by 20 dB. At the same time, the level of PSD of DC component in the “π/
2” mode has significantly more level at offsets closed to the zero.
Now we can make a conclusion that representation of OEO MZ as the correlator
of random quantities and consideration of the structure in different operation modes
(quadrature and non-quadrature) gives a possibility to simplify the mathematical
notation of the autocorrelation function R MZ (u, t, t + τ) and in open loop of OEO
10
1.0
0.5
0.5
1.0
–0.5
–0.5
–1.0
–1.0
(a)
(b)
4.5
10
2.5
2.0
1.5
1.0
0.5
50
100
f 0
f
150
4.5
MZ / T c = 3
MZ / T c = 3
R MZ
S RFMZ
t
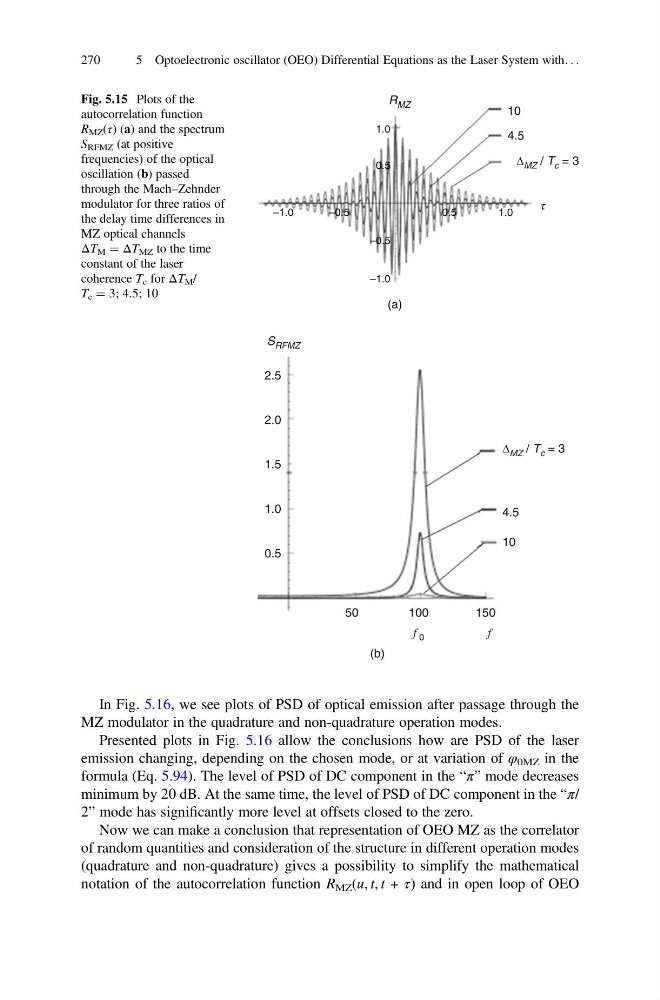
Fig. 5.15 Plots of the
autocorrelation function
R MZ (τ) (a) and the spectrum
S RFMZ (at positive
frequencies) of the optical
oscillation (b) passed
through the Mach–Zehnder
modulator for three ratios of
the delay time differences in
MZ optical channels
ΔT M ¼ ΔT MZ to the time
constant of the laser
coherence T c for ΔT M /
T c ¼ 3; 4.5; 10
270
5 Optoelectronic oscillator (OEO) Differential Equations as the Laser System with. . .
MZ modulator in the quadrature and non-quadrature operation modes.
Presented plots in Fig. 5.16 allow the conclusions how are PSD of the laser
emission changing, depending on the chosen mode, or at variation of φ 0MZ in the
formula (Eq. 5.94). The level of PSD of DC component in the “π” mode decreases
minimum by 20 dB. At the same time, the level of PSD of DC component in the “π/
2” mode has significantly more level at offsets closed to the zero.
Now we can make a conclusion that representation of OEO MZ as the correlator
of random quantities and consideration of the structure in different operation modes
(quadrature and non-quadrature) gives a possibility to simplify the mathematical
notation of the autocorrelation function R MZ (u, t, t + τ) and in open loop of OEO
10
1.0
0.5
0.5
1.0
–0.5
–0.5
–1.0
–1.0
(a)
(b)
4.5
10
2.5
2.0
1.5
1.0
0.5
50
100
f 0
f
150
4.5
MZ / T c = 3
MZ / T c = 3
R MZ
S RFMZ
t
Fig. 5.15 Plots of the
autocorrelation function
R MZ (τ) (a) and the spectrum
S RFMZ (at positive
frequencies) of the optical
oscillation (b) passed
through the Mach–Zehnder
modulator for three ratios of
the delay time differences in
MZ optical channels
ΔT M ¼ ΔT MZ to the time
constant of the laser
coherence T c for ΔT M /
T c ¼ 3; 4.5; 10
270
5 Optoelectronic oscillator (OEO) Differential Equations as the Laser System with. . .