

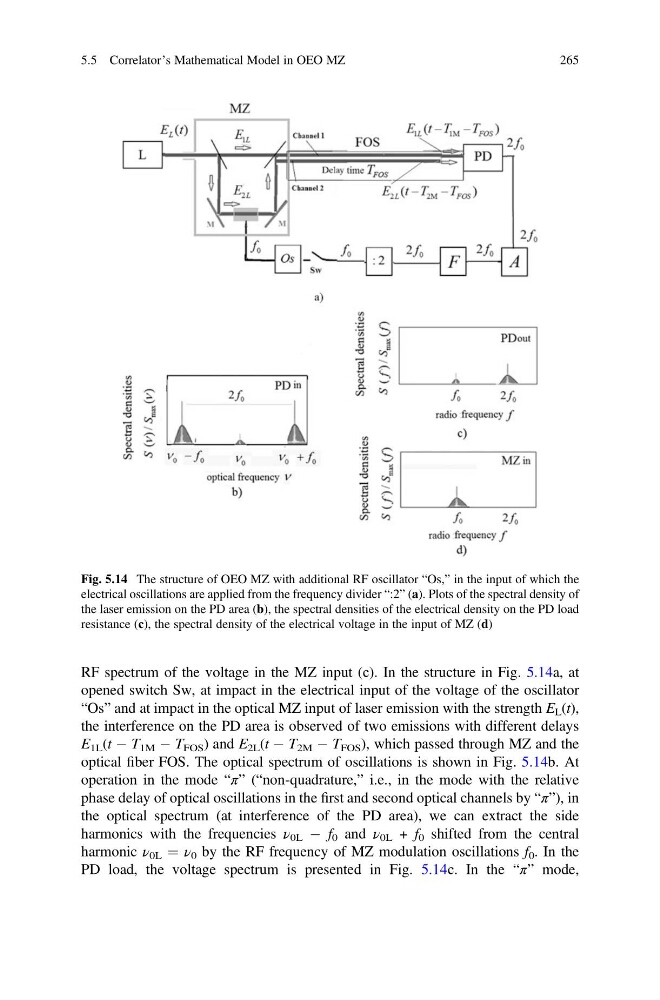
RF spectrum of the voltage in the MZ input (с). In the structure in Fig. 5.14a, at
opened switch Sw, at impact in the electrical input of the voltage of the oscillator
“Os” and at impact in the optical MZ input of laser emission with the strength E L (t),
the interference on the PD area is observed of two emissions with different delays
E 1L (t À T 1M À T FOS ) and E 2L (t À T 2M À T FOS ), which passed through MZ and the
optical fiber FOS. The optical spectrum of oscillations is shown in Fig. 5.14b. At
operation in the mode “π” (“non-quadrature,” i.e., in the mode with the relative
phase delay of optical oscillations in the first and second optical channels by “π”), in
the optical spectrum (at interference of the PD area), we can extract the side
harmonics with the frequencies ν 0L À f 0 and ν 0L + f 0 shifted from the central
harmonic ν 0L ¼ ν 0 by the RF frequency of MZ modulation oscillations f 0 . In the
PD load, the voltage spectrum is presented in Fig. 5.14с. In the “π” mode,
Fig. 5.14 The structure of OEO MZ with additional RF oscillator “Os,” in the input of which the
electrical oscillations are applied from the frequency divider “:2” (a). Plots of the spectral density of
the laser emission on the PD area (b), the spectral densities of the electrical density on the PD load
resistance (с), the spectral density of the electrical voltage in the input of MZ (d)
5.5 Correlator’s Mathematical Model in OEO MZ
265
opened switch Sw, at impact in the electrical input of the voltage of the oscillator
“Os” and at impact in the optical MZ input of laser emission with the strength E L (t),
the interference on the PD area is observed of two emissions with different delays
E 1L (t À T 1M À T FOS ) and E 2L (t À T 2M À T FOS ), which passed through MZ and the
optical fiber FOS. The optical spectrum of oscillations is shown in Fig. 5.14b. At
operation in the mode “π” (“non-quadrature,” i.e., in the mode with the relative
phase delay of optical oscillations in the first and second optical channels by “π”), in
the optical spectrum (at interference of the PD area), we can extract the side
harmonics with the frequencies ν 0L À f 0 and ν 0L + f 0 shifted from the central
harmonic ν 0L ¼ ν 0 by the RF frequency of MZ modulation oscillations f 0 . In the
PD load, the voltage spectrum is presented in Fig. 5.14с. In the “π” mode,
Fig. 5.14 The structure of OEO MZ with additional RF oscillator “Os,” in the input of which the
electrical oscillations are applied from the frequency divider “:2” (a). Plots of the spectral density of
the laser emission on the PD area (b), the spectral densities of the electrical density on the PD load
resistance (с), the spectral density of the electrical voltage in the input of MZ (d)
5.5 Correlator’s Mathematical Model in OEO MZ
265