

OEO spectrum investigation and the noise analysis at OEO representation as the
random quantities’ correlator. Principles examined below are supplemented of our
analysis fulfilled.
5.5 Correlator’s Mathematical Model in OEO MZ
This section is devoted the analysis of OEO with Mach–Zehnder modulator at
representation of the optoelectronic “laser—MZ modulator—PD” structure by the
correlator of two random quantities. We calculate the oscillations spectrum taking
into consideration the amplitude and phase fluctuations for the OEO MZ structure
depicted in Fig. 5.10, which presents the heterodyning with a delay in OEO MZ,
where the laser is the noise source.
Figure 5.10 shows the structure of OEO MZ earlier-examined (a) and pictures of
the optical spectra (or spectral densities) (b, c) and RF spectra (or spectral densities)
(d, e). The laser optical emission spectrum on the PD area (Fig. 5.10b) is shown
without account of the optical filter action located in FOS, and Fig. 5.10c presents
the account of the optical filter action, which suppresses the side harmonic on the
frequency ν 0 À f 0 or ν 0L À f 0 .
The normalized correlation function of the oscillation E L ¼ E L (t) in the MZ
modulator output is the time-function, which unambiguously determines the frequency spectrum of the oscillation power. The laser EMF strength E L ¼ E L (t) and
the strength E Lτ ¼ E L (t À Δt) delayed by the time Δt ¼ τ are the random correlated
quantities in the optical part of OEO. The random quantities are dependent. Now we
study the autocorrelation function at passage of the laser emission through the MZ
0.05 0.10
0.50
1
2
3
10
1
100
K
2 (F·T
F ) (dB)
0.1
Offset frequency
1
5 1 0
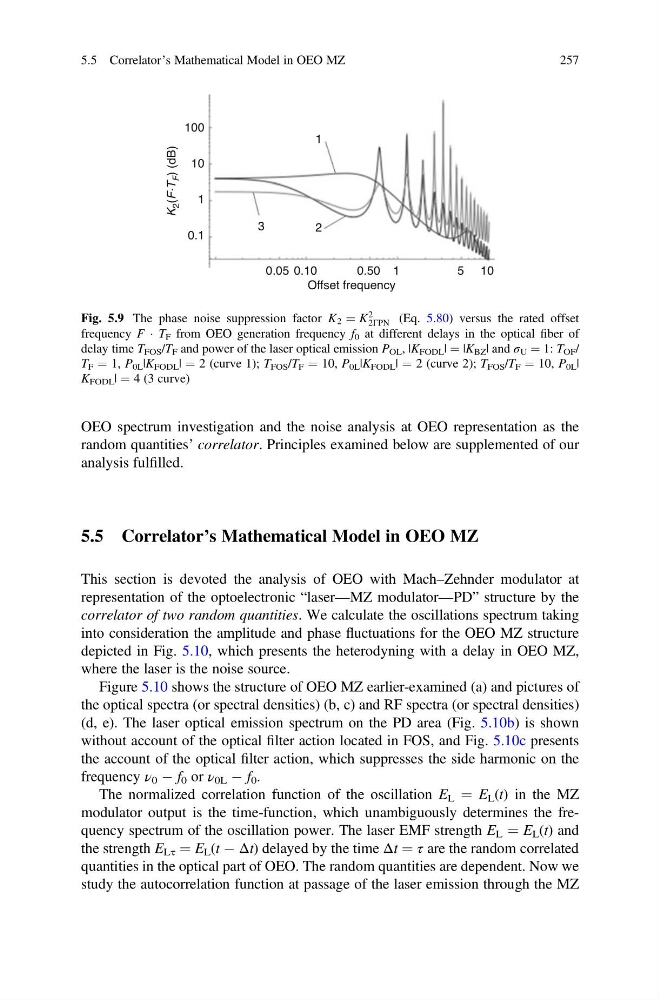
Fig. 5.9 The phase noise suppression factor K 2 ¼ K
2
2ΓPN (Eq. 5.80) versus the rated offset
frequency F Á T F from OEO generation frequency f 0 at different delays in the optical fiber of
delay time T FOS /T F and power of the laser optical emission P OL , |K FODL | ¼ |K BZ | and σ U ¼ 1: T OF /
T F ¼ 1, P 0L |K FODL | ¼ 2 (curve 1); T FOS /T F ¼ 10, P 0L |K FODL | ¼ 2 (curve 2); T FOS /T F ¼ 10, P 0L |
K FODL | ¼ 4 (3 curve)
5.5 Correlator’s Mathematical Model in OEO MZ
257
random quantities’ correlator. Principles examined below are supplemented of our
analysis fulfilled.
5.5 Correlator’s Mathematical Model in OEO MZ
This section is devoted the analysis of OEO with Mach–Zehnder modulator at
representation of the optoelectronic “laser—MZ modulator—PD” structure by the
correlator of two random quantities. We calculate the oscillations spectrum taking
into consideration the amplitude and phase fluctuations for the OEO MZ structure
depicted in Fig. 5.10, which presents the heterodyning with a delay in OEO MZ,
where the laser is the noise source.
Figure 5.10 shows the structure of OEO MZ earlier-examined (a) and pictures of
the optical spectra (or spectral densities) (b, c) and RF spectra (or spectral densities)
(d, e). The laser optical emission spectrum on the PD area (Fig. 5.10b) is shown
without account of the optical filter action located in FOS, and Fig. 5.10c presents
the account of the optical filter action, which suppresses the side harmonic on the
frequency ν 0 À f 0 or ν 0L À f 0 .
The normalized correlation function of the oscillation E L ¼ E L (t) in the MZ
modulator output is the time-function, which unambiguously determines the frequency spectrum of the oscillation power. The laser EMF strength E L ¼ E L (t) and
the strength E Lτ ¼ E L (t À Δt) delayed by the time Δt ¼ τ are the random correlated
quantities in the optical part of OEO. The random quantities are dependent. Now we
study the autocorrelation function at passage of the laser emission through the MZ
0.05 0.10
0.50
1
2
3
10
1
100
K
2 (F·T
F ) (dB)
0.1
Offset frequency
1
5 1 0
Fig. 5.9 The phase noise suppression factor K 2 ¼ K
2
2ΓPN (Eq. 5.80) versus the rated offset
frequency F Á T F from OEO generation frequency f 0 at different delays in the optical fiber of
delay time T FOS /T F and power of the laser optical emission P OL , |K FODL | ¼ |K BZ | and σ U ¼ 1: T OF /
T F ¼ 1, P 0L |K FODL | ¼ 2 (curve 1); T FOS /T F ¼ 10, P 0L |K FODL | ¼ 2 (curve 2); T FOS /T F ¼ 10, P 0L |
K FODL | ¼ 4 (3 curve)
5.5 Correlator’s Mathematical Model in OEO MZ
257