

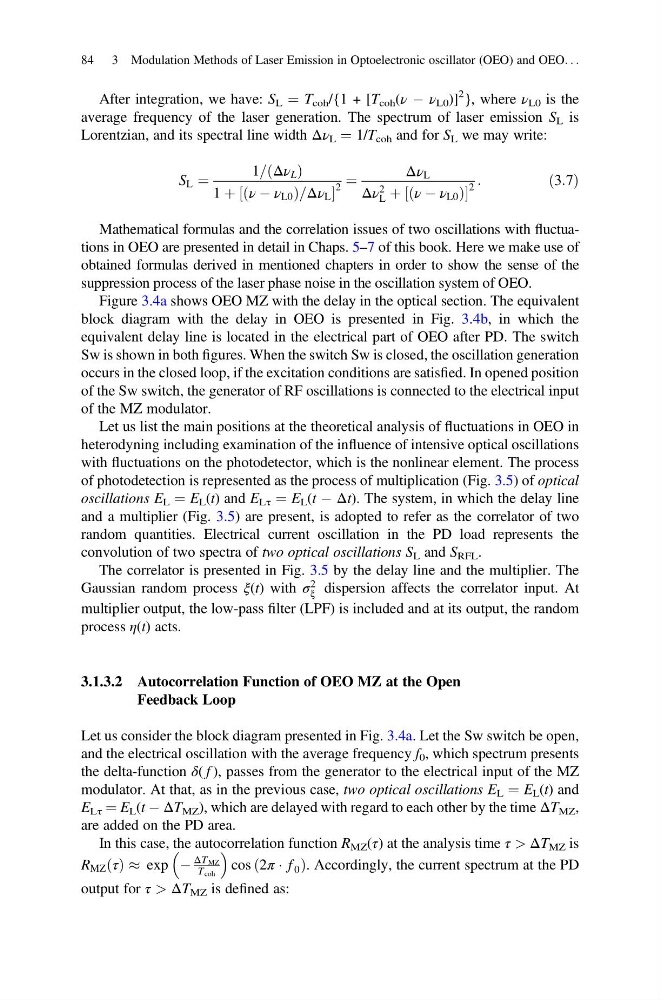
After integration, we have: S L ¼ T coh /{1 + [T coh (ν À ν L0 )]
2 }, where ν L0 is the
average frequency of the laser generation. The spectrum of laser emission S L is
Lorentzian, and its spectral line width Δν L ¼ 1/T coh and for S L we may write:
S L ¼
1= Δν L
ð
Þ
1 þ ν À ν L0
ð
Þ=Δν L
½
2
¼
Δν L
Δν 2
L þ ν À ν L0
ð
Þ
½
2
:
ð3:7Þ
Mathematical formulas and the correlation issues of two oscillations with fluctuations in OEO are presented in detail in Chaps. 5–7 of this book. Here we make use of
obtained formulas derived in mentioned chapters in order to show the sense of the
suppression process of the laser phase noise in the oscillation system of OEO.
Figure 3.4a shows OEO MZ with the delay in the optical section. The equivalent
block diagram with the delay in OEO is presented in Fig. 3.4b, in which the
equivalent delay line is located in the electrical part of OEO after PD. The switch
Sw is shown in both figures. When the switch Sw is closed, the oscillation generation
occurs in the closed loop, if the excitation conditions are satisfied. In opened position
of the Sw switch, the generator of RF oscillations is connected to the electrical input
of the MZ modulator.
Let us list the main positions at the theoretical analysis of fluctuations in OEO in
heterodyning including examination of the influence of intensive optical oscillations
with fluctuations on the photodetector, which is the nonlinear element. The process
of photodetection is represented as the process of multiplication (Fig. 3.5) of optical
oscillations E L ¼ E L (t) and E Lτ ¼ E L (t À Δt). The system, in which the delay line
and a multiplier (Fig. 3.5) are present, is adopted to refer as the correlator of two
random quantities. Electrical current oscillation in the PD load represents the
convolution of two spectra of two optical oscillations S L and S RFL .
The correlator is presented in Fig. 3.5 by the delay line and the multiplier. The
Gaussian random process ξ(t) with σ
2
ξ dispersion affects the correlator input. At
multiplier output, the low-pass filter (LPF) is included and at its output, the random
process η(t) acts.
3.1.3.2 Autocorrelation Function of OEO MZ at the Open
Feedback Loop
Let us consider the block diagram presented in Fig. 3.4a. Let the Sw switch be open,
and the electrical oscillation with the average frequency f 0 , which spectrum presents
the delta-function δ( f ), passes from the generator to the electrical input of the MZ
modulator. At that, as in the previous case, two optical oscillations E L ¼ E L (t) and
E Lτ ¼ E L (t À ΔT MZ ), which are delayed with regard to each other by the time ΔT MZ ,
are added on the PD area.
In this case, the autocorrelation function R MZ (τ) at the analysis time τ > ΔT MZ is
R MZ τ
ð Þ % exp À
ΔT MZ
T coh
cos 2π Á f 0
ð
Þ. Accordingly, the current spectrum at the PD
output for τ > ΔT MZ is defined as:
84 3 Modulation Methods of Laser Emission in Optoelectronic oscillator (OEO) and OEO. . .
2 }, where ν L0 is the
average frequency of the laser generation. The spectrum of laser emission S L is
Lorentzian, and its spectral line width Δν L ¼ 1/T coh and for S L we may write:
S L ¼
1= Δν L
ð
Þ
1 þ ν À ν L0
ð
Þ=Δν L
½
2
¼
Δν L
Δν 2
L þ ν À ν L0
ð
Þ
½
2
:
ð3:7Þ
Mathematical formulas and the correlation issues of two oscillations with fluctuations in OEO are presented in detail in Chaps. 5–7 of this book. Here we make use of
obtained formulas derived in mentioned chapters in order to show the sense of the
suppression process of the laser phase noise in the oscillation system of OEO.
Figure 3.4a shows OEO MZ with the delay in the optical section. The equivalent
block diagram with the delay in OEO is presented in Fig. 3.4b, in which the
equivalent delay line is located in the electrical part of OEO after PD. The switch
Sw is shown in both figures. When the switch Sw is closed, the oscillation generation
occurs in the closed loop, if the excitation conditions are satisfied. In opened position
of the Sw switch, the generator of RF oscillations is connected to the electrical input
of the MZ modulator.
Let us list the main positions at the theoretical analysis of fluctuations in OEO in
heterodyning including examination of the influence of intensive optical oscillations
with fluctuations on the photodetector, which is the nonlinear element. The process
of photodetection is represented as the process of multiplication (Fig. 3.5) of optical
oscillations E L ¼ E L (t) and E Lτ ¼ E L (t À Δt). The system, in which the delay line
and a multiplier (Fig. 3.5) are present, is adopted to refer as the correlator of two
random quantities. Electrical current oscillation in the PD load represents the
convolution of two spectra of two optical oscillations S L and S RFL .
The correlator is presented in Fig. 3.5 by the delay line and the multiplier. The
Gaussian random process ξ(t) with σ
2
ξ dispersion affects the correlator input. At
multiplier output, the low-pass filter (LPF) is included and at its output, the random
process η(t) acts.
3.1.3.2 Autocorrelation Function of OEO MZ at the Open
Feedback Loop
Let us consider the block diagram presented in Fig. 3.4a. Let the Sw switch be open,
and the electrical oscillation with the average frequency f 0 , which spectrum presents
the delta-function δ( f ), passes from the generator to the electrical input of the MZ
modulator. At that, as in the previous case, two optical oscillations E L ¼ E L (t) and
E Lτ ¼ E L (t À ΔT MZ ), which are delayed with regard to each other by the time ΔT MZ ,
are added on the PD area.
In this case, the autocorrelation function R MZ (τ) at the analysis time τ > ΔT MZ is
R MZ τ
ð Þ % exp À
ΔT MZ
T coh
cos 2π Á f 0
ð
Þ. Accordingly, the current spectrum at the PD
output for τ > ΔT MZ is defined as:
84 3 Modulation Methods of Laser Emission in Optoelectronic oscillator (OEO) and OEO. . .