

8.6 Man-made X-rays
299
˜
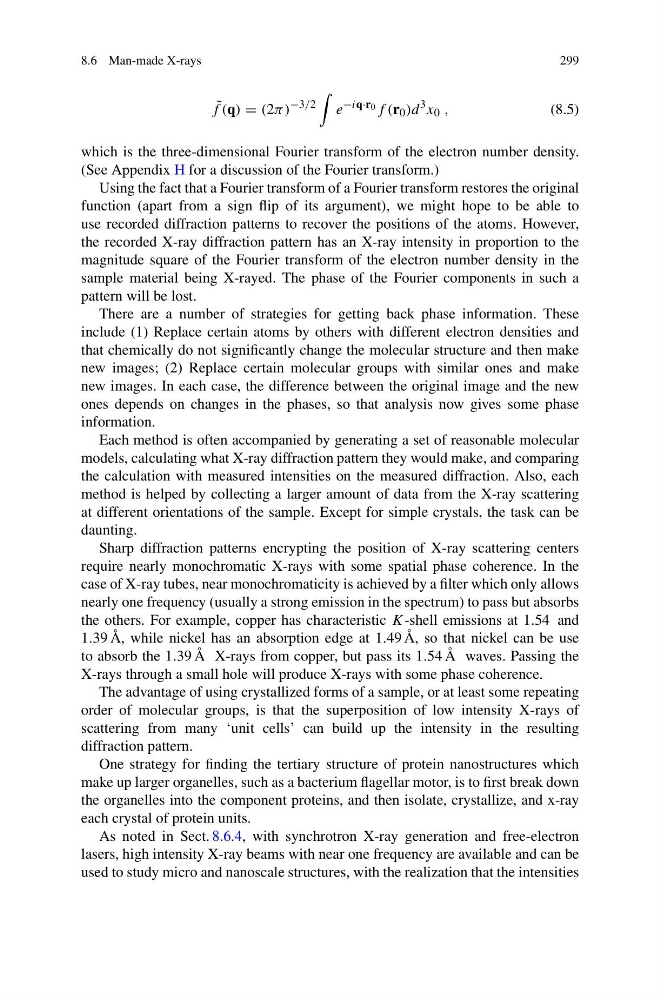
f (q) = (2π)
−3/2
e
−iq·r 0 f (r 0 )d
3 x 0 ,
(8.5)
which is the three-dimensional Fourier transform of the electron number density.
(See Appendix H for a discussion of the Fourier transform.)
Using the fact that a Fourier transform of a Fourier transform restores the original
function (apart from a sign flip of its argument), we might hope to be able to
use recorded diffraction patterns to recover the positions of the atoms. However,
the recorded X-ray diffraction pattern has an X-ray intensity in proportion to the
magnitude square of the Fourier transform of the electron number density in the
sample material being X-rayed. The phase of the Fourier components in such a
pattern will be lost.
There are a number of strategies for getting back phase information. These
include (1) Replace certain atoms by others with different electron densities and
that chemically do not significantly change the molecular structure and then make
new images; (2) Replace certain molecular groups with similar ones and make
new images. In each case, the difference between the original image and the new
ones depends on changes in the phases, so that analysis now gives some phase
information.
Each method is often accompanied by generating a set of reasonable molecular
models, calculating what X-ray diffraction pattern they would make, and comparing
the calculation with measured intensities on the measured diffraction. Also, each
method is helped by collecting a larger amount of data from the X-ray scattering
at different orientations of the sample. Except for simple crystals, the task can be
daunting.
Sharp diffraction patterns encrypting the position of X-ray scattering centers
require nearly monochromatic X-rays with some spatial phase coherence. In the
case of X-ray tubes, near monochromaticity is achieved by a filter which only allows
nearly one frequency (usually a strong emission in the spectrum) to pass but absorbs
the others. For example, copper has characteristic K-shell emissions at 1.54 and
1.39 Å, while nickel has an absorption edge at 1.49 Å, so that nickel can be use
to absorb the 1.39 Å X-rays from copper, but pass its 1.54 Å waves. Passing the
X-rays through a small hole will produce X-rays with some phase coherence.
The advantage of using crystallized forms of a sample, or at least some repeating
order of molecular groups, is that the superposition of low intensity X-rays of
scattering from many ‘unit cells’ can build up the intensity in the resulting
diffraction pattern.
One strategy for finding the tertiary structure of protein nanostructures which
make up larger organelles, such as a bacterium flagellar motor, is to first break down
the organelles into the component proteins, and then isolate, crystallize, and x-ray
each crystal of protein units.
As noted in Sect. 8.6.4, with synchrotron X-ray generation and free-electron
lasers, high intensity X-ray beams with near one frequency are available and can be
used to study micro and nanoscale structures, with the realization that the intensities
299
˜
f (q) = (2π)
−3/2
e
−iq·r 0 f (r 0 )d
3 x 0 ,
(8.5)
which is the three-dimensional Fourier transform of the electron number density.
(See Appendix H for a discussion of the Fourier transform.)
Using the fact that a Fourier transform of a Fourier transform restores the original
function (apart from a sign flip of its argument), we might hope to be able to
use recorded diffraction patterns to recover the positions of the atoms. However,
the recorded X-ray diffraction pattern has an X-ray intensity in proportion to the
magnitude square of the Fourier transform of the electron number density in the
sample material being X-rayed. The phase of the Fourier components in such a
pattern will be lost.
There are a number of strategies for getting back phase information. These
include (1) Replace certain atoms by others with different electron densities and
that chemically do not significantly change the molecular structure and then make
new images; (2) Replace certain molecular groups with similar ones and make
new images. In each case, the difference between the original image and the new
ones depends on changes in the phases, so that analysis now gives some phase
information.
Each method is often accompanied by generating a set of reasonable molecular
models, calculating what X-ray diffraction pattern they would make, and comparing
the calculation with measured intensities on the measured diffraction. Also, each
method is helped by collecting a larger amount of data from the X-ray scattering
at different orientations of the sample. Except for simple crystals, the task can be
daunting.
Sharp diffraction patterns encrypting the position of X-ray scattering centers
require nearly monochromatic X-rays with some spatial phase coherence. In the
case of X-ray tubes, near monochromaticity is achieved by a filter which only allows
nearly one frequency (usually a strong emission in the spectrum) to pass but absorbs
the others. For example, copper has characteristic K-shell emissions at 1.54 and
1.39 Å, while nickel has an absorption edge at 1.49 Å, so that nickel can be use
to absorb the 1.39 Å X-rays from copper, but pass its 1.54 Å waves. Passing the
X-rays through a small hole will produce X-rays with some phase coherence.
The advantage of using crystallized forms of a sample, or at least some repeating
order of molecular groups, is that the superposition of low intensity X-rays of
scattering from many ‘unit cells’ can build up the intensity in the resulting
diffraction pattern.
One strategy for finding the tertiary structure of protein nanostructures which
make up larger organelles, such as a bacterium flagellar motor, is to first break down
the organelles into the component proteins, and then isolate, crystallize, and x-ray
each crystal of protein units.
As noted in Sect. 8.6.4, with synchrotron X-ray generation and free-electron
lasers, high intensity X-ray beams with near one frequency are available and can be
used to study micro and nanoscale structures, with the realization that the intensities