

Dynamics and Energetics of Methane …
123
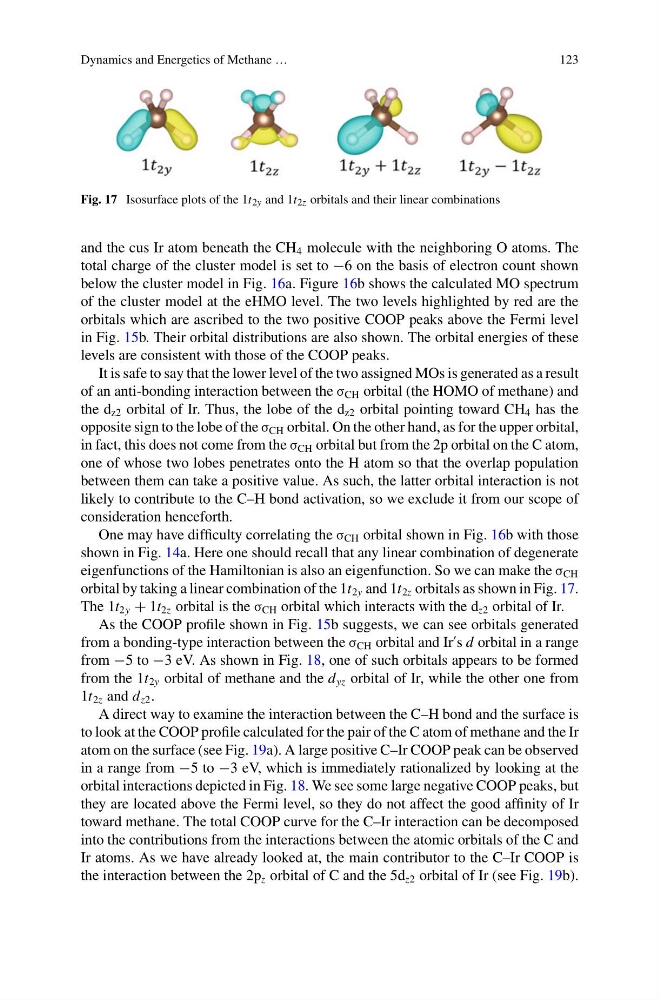
Fig. 17 Isosurface plots of the 1t 2y and 1t 2z orbitals and their linear combinations
and the cus Ir atom beneath the CH 4 molecule with the neighboring O atoms. The
total charge of the cluster model is set to −6 on the basis of electron count shown
below the cluster model in Fig. 16a. Figure 16b shows the calculated MO spectrum
of the cluster model at the eHMO level. The two levels highlighted by red are the
orbitals which are ascribed to the two positive COOP peaks above the Fermi level
in Fig. 15b. Their orbital distributions are also shown. The orbital energies of these
levels are consistent with those of the COOP peaks.
It is safe to say that the lower level of the two assigned MOs is generated as a result
of an anti-bonding interaction between the σ CH orbital (the HOMO of methane) and
the d z2 orbital of Ir. Thus, the lobe of the d z2 orbital pointing toward CH 4 has the
opposite sign to the lobe of the σ CH orbital. On the other hand, as for the upper orbital,
in fact, this does not come from the σ CH orbital but from the 2p orbital on the C atom,
one of whose two lobes penetrates onto the H atom so that the overlap population
between them can take a positive value. As such, the latter orbital interaction is not
likely to contribute to the C–H bond activation, so we exclude it from our scope of
consideration henceforth.
One may have difficulty correlating the σ CH orbital shown in Fig. 16b with those
shown in Fig. 14a. Here one should recall that any linear combination of degenerate
eigenfunctions of the Hamiltonian is also an eigenfunction. So we can make the σ CH
orbital by taking a linear combination of the 1t 2y and 1t 2z orbitals as shown in Fig. 17.
The 1t 2y + 1t 2z orbital is the σ CH orbital which interacts with the d z2 orbital of Ir.
As the COOP profile shown in Fig. 15b suggests, we can see orbitals generated
from a bonding-type interaction between the σ CH orbital and Ir
s d orbital in a range
from −5 to −3 eV. As shown in Fig. 18, one of such orbitals appears to be formed
from the 1t 2y orbital of methane and the d yz orbital of Ir, while the other one from
1t 2z and d z2 .
A direct way to examine the interaction between the C–H bond and the surface is
to look at the COOP profile calculated for the pair of the C atom of methane and the Ir
atom on the surface (see Fig. 19a). A large positive C–Ir COOP peak can be observed
in a range from −5 to −3 eV, which is immediately rationalized by looking at the
orbital interactions depicted in Fig. 18. We see some large negative COOP peaks, but
they are located above the Fermi level, so they do not affect the good affinity of Ir
toward methane. The total COOP curve for the C–Ir interaction can be decomposed
into the contributions from the interactions between the atomic orbitals of the C and
Ir atoms. As we have already looked at, the main contributor to the C–Ir COOP is
the interaction between the 2p z orbital of C and the 5d z2 orbital of Ir (see Fig. 19b).
123
Fig. 17 Isosurface plots of the 1t 2y and 1t 2z orbitals and their linear combinations
and the cus Ir atom beneath the CH 4 molecule with the neighboring O atoms. The
total charge of the cluster model is set to −6 on the basis of electron count shown
below the cluster model in Fig. 16a. Figure 16b shows the calculated MO spectrum
of the cluster model at the eHMO level. The two levels highlighted by red are the
orbitals which are ascribed to the two positive COOP peaks above the Fermi level
in Fig. 15b. Their orbital distributions are also shown. The orbital energies of these
levels are consistent with those of the COOP peaks.
It is safe to say that the lower level of the two assigned MOs is generated as a result
of an anti-bonding interaction between the σ CH orbital (the HOMO of methane) and
the d z2 orbital of Ir. Thus, the lobe of the d z2 orbital pointing toward CH 4 has the
opposite sign to the lobe of the σ CH orbital. On the other hand, as for the upper orbital,
in fact, this does not come from the σ CH orbital but from the 2p orbital on the C atom,
one of whose two lobes penetrates onto the H atom so that the overlap population
between them can take a positive value. As such, the latter orbital interaction is not
likely to contribute to the C–H bond activation, so we exclude it from our scope of
consideration henceforth.
One may have difficulty correlating the σ CH orbital shown in Fig. 16b with those
shown in Fig. 14a. Here one should recall that any linear combination of degenerate
eigenfunctions of the Hamiltonian is also an eigenfunction. So we can make the σ CH
orbital by taking a linear combination of the 1t 2y and 1t 2z orbitals as shown in Fig. 17.
The 1t 2y + 1t 2z orbital is the σ CH orbital which interacts with the d z2 orbital of Ir.
As the COOP profile shown in Fig. 15b suggests, we can see orbitals generated
from a bonding-type interaction between the σ CH orbital and Ir
s d orbital in a range
from −5 to −3 eV. As shown in Fig. 18, one of such orbitals appears to be formed
from the 1t 2y orbital of methane and the d yz orbital of Ir, while the other one from
1t 2z and d z2 .
A direct way to examine the interaction between the C–H bond and the surface is
to look at the COOP profile calculated for the pair of the C atom of methane and the Ir
atom on the surface (see Fig. 19a). A large positive C–Ir COOP peak can be observed
in a range from −5 to −3 eV, which is immediately rationalized by looking at the
orbital interactions depicted in Fig. 18. We see some large negative COOP peaks, but
they are located above the Fermi level, so they do not affect the good affinity of Ir
toward methane. The total COOP curve for the C–Ir interaction can be decomposed
into the contributions from the interactions between the atomic orbitals of the C and
Ir atoms. As we have already looked at, the main contributor to the C–Ir COOP is
the interaction between the 2p z orbital of C and the 5d z2 orbital of Ir (see Fig. 19b).