

122
Y. Tsuji et al.
unchanged. By contrast, around the Fermi level, some changes can be discerned; for
example, the peaks get more broadened, and two positive COOP peaks appear above
the Fermi level.
In the COOP profile of the C–H bond of the methane molecule without interaction
with the surface, positive COOP peaks lie below the Fermi level, while negative ones
lie above the Fermi level (see Fig. 15a). This follows that bonding-type C–H orbitals
are fully occupied, yet anti-bonding-type C–H orbitals are emptied. However, the
interaction with the surface makes a difference: two unoccupied bonding-type C–H
orbitals emerge above the Fermi level. This implies that the adsorption of methane
makes the C–H bond weak more or less. We wish to identify these peaks, but we are
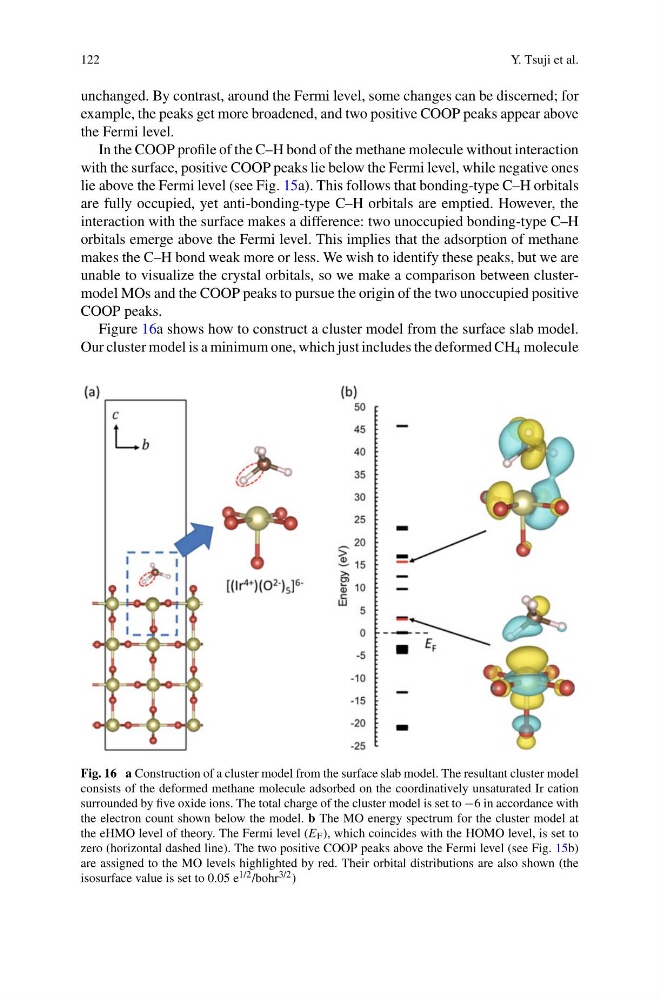
unable to visualize the crystal orbitals, so we make a comparison between clustermodel MOs and the COOP peaks to pursue the origin of the two unoccupied positive
COOP peaks.
Figure 16a shows how to construct a cluster model from the surface slab model.
Our cluster model is a minimum one, which just includes the deformed CH 4 molecule
Fig. 16 a Construction of a cluster model from the surface slab model. The resultant cluster model
consists of the deformed methane molecule adsorbed on the coordinatively unsaturated Ir cation
surrounded by five oxide ions. The total charge of the cluster model is set to −6 in accordance with
the electron count shown below the model. b The MO energy spectrum for the cluster model at
the eHMO level of theory. The Fermi level (E F ), which coincides with the HOMO level, is set to
zero (horizontal dashed line). The two positive COOP peaks above the Fermi level (see Fig. 15b)
are assigned to the MO levels highlighted by red. Their orbital distributions are also shown (the
isosurface value is set to 0.05 e 1/2 /bohr 3/2 )
Y. Tsuji et al.
unchanged. By contrast, around the Fermi level, some changes can be discerned; for
example, the peaks get more broadened, and two positive COOP peaks appear above
the Fermi level.
In the COOP profile of the C–H bond of the methane molecule without interaction
with the surface, positive COOP peaks lie below the Fermi level, while negative ones
lie above the Fermi level (see Fig. 15a). This follows that bonding-type C–H orbitals
are fully occupied, yet anti-bonding-type C–H orbitals are emptied. However, the
interaction with the surface makes a difference: two unoccupied bonding-type C–H
orbitals emerge above the Fermi level. This implies that the adsorption of methane
makes the C–H bond weak more or less. We wish to identify these peaks, but we are
unable to visualize the crystal orbitals, so we make a comparison between clustermodel MOs and the COOP peaks to pursue the origin of the two unoccupied positive
COOP peaks.
Figure 16a shows how to construct a cluster model from the surface slab model.
Our cluster model is a minimum one, which just includes the deformed CH 4 molecule
Fig. 16 a Construction of a cluster model from the surface slab model. The resultant cluster model
consists of the deformed methane molecule adsorbed on the coordinatively unsaturated Ir cation
surrounded by five oxide ions. The total charge of the cluster model is set to −6 in accordance with
the electron count shown below the model. b The MO energy spectrum for the cluster model at
the eHMO level of theory. The Fermi level (E F ), which coincides with the HOMO level, is set to
zero (horizontal dashed line). The two positive COOP peaks above the Fermi level (see Fig. 15b)
are assigned to the MO levels highlighted by red. Their orbital distributions are also shown (the
isosurface value is set to 0.05 e 1/2 /bohr 3/2 )