

36
2 Theory: Bond-Electron-Energy Correlation
d/d s = 1 − 0.26 ln(n)/d s
E/E s = exp[c(d s − d)] = n
p
(2.9)
where subscript s stands for the “single bond”, c and p are hypothetic coefficients.
This BOLS estimates: (i) binding energies released during gas-solid reaction and (ii)
activation energies for chemisorption or desorption [28–33].
2.3.3.2 Interface Potential: Entrapment or Polarization
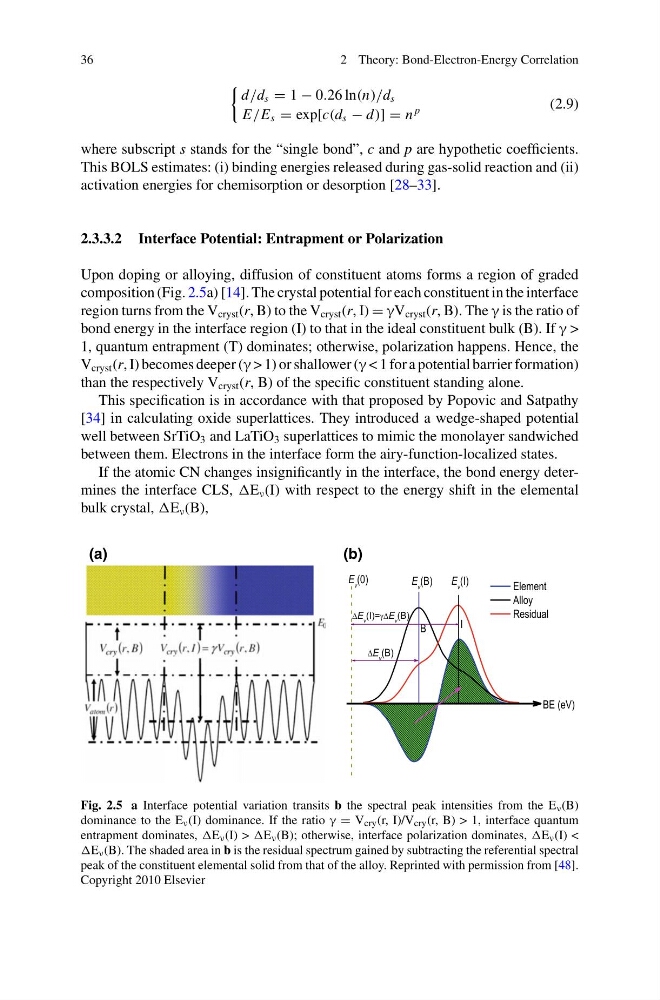
Upon doping or alloying, diffusion of constituent atoms forms a region of graded
composition (Fig. 2.5a) [14]. The crystal potential for each constituent in the interface
region turns from the V cryst (r, B) to the V cryst (r, I) = γV cryst (r, B). The γ is the ratio of
bond energy in the interface region (I) to that in the ideal constituent bulk (B). If γ >
1, quantum entrapment (T) dominates; otherwise, polarization happens. Hence, the
V cryst (r, I) becomes deeper (γ > 1) or shallower (γ < 1 for a potential barrier formation)
than the respectively V cryst (r, B) of the specific constituent standing alone.
This specification is in accordance with that proposed by Popovic and Satpathy
[34] in calculating oxide superlattices. They introduced a wedge-shaped potential
well between SrTiO 3 and LaTiO 3 superlattices to mimic the monolayer sandwiched
between them. Electrons in the interface form the airy-function-localized states.
If the atomic CN changes insignificantly in the interface, the bond energy determines the interface CLS, ν (I) with respect to the energy shift in the elemental
bulk crystal, ν (B),
(a)
(b)
Fig. 2.5 a Interface potential variation transits b the spectral peak intensities from the E ν (B)
dominance to the E ν (I) dominance. If the ratio γ = V cry (r, I)/V cry (r, B) > 1, interface quantum
entrapment dominates, ν (I) > ν (B); otherwise, interface polarization dominates, ν (I) <
ν (B). The shaded area in b is the residual spectrum gained by subtracting the referential spectral
peak of the constituent elemental solid from that of the alloy. Reprinted with permission from [48].
Copyright 2010 Elsevier
2 Theory: Bond-Electron-Energy Correlation
d/d s = 1 − 0.26 ln(n)/d s
E/E s = exp[c(d s − d)] = n
p
(2.9)
where subscript s stands for the “single bond”, c and p are hypothetic coefficients.
This BOLS estimates: (i) binding energies released during gas-solid reaction and (ii)
activation energies for chemisorption or desorption [28–33].
2.3.3.2 Interface Potential: Entrapment or Polarization
Upon doping or alloying, diffusion of constituent atoms forms a region of graded
composition (Fig. 2.5a) [14]. The crystal potential for each constituent in the interface
region turns from the V cryst (r, B) to the V cryst (r, I) = γV cryst (r, B). The γ is the ratio of
bond energy in the interface region (I) to that in the ideal constituent bulk (B). If γ >
1, quantum entrapment (T) dominates; otherwise, polarization happens. Hence, the
V cryst (r, I) becomes deeper (γ > 1) or shallower (γ < 1 for a potential barrier formation)
than the respectively V cryst (r, B) of the specific constituent standing alone.
This specification is in accordance with that proposed by Popovic and Satpathy
[34] in calculating oxide superlattices. They introduced a wedge-shaped potential
well between SrTiO 3 and LaTiO 3 superlattices to mimic the monolayer sandwiched
between them. Electrons in the interface form the airy-function-localized states.
If the atomic CN changes insignificantly in the interface, the bond energy determines the interface CLS, ν (I) with respect to the energy shift in the elemental
bulk crystal, ν (B),
(a)
(b)
Fig. 2.5 a Interface potential variation transits b the spectral peak intensities from the E ν (B)
dominance to the E ν (I) dominance. If the ratio γ = V cry (r, I)/V cry (r, B) > 1, interface quantum
entrapment dominates, ν (I) > ν (B); otherwise, interface polarization dominates, ν (I) <
ν (B). The shaded area in b is the residual spectrum gained by subtracting the referential spectral
peak of the constituent elemental solid from that of the alloy. Reprinted with permission from [48].
Copyright 2010 Elsevier