

434
22 Layered Structures
22.3.3.5 Debye Thermal Decay of Phonon Frequency
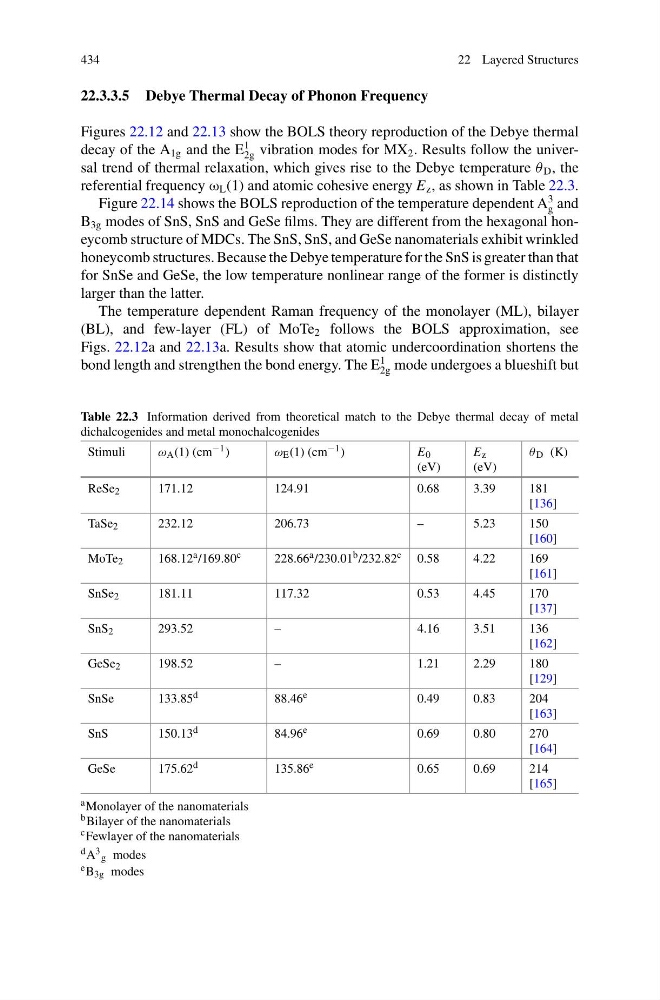
Figures 22.12 and 22.13 show the BOLS theory reproduction of the Debye thermal
decay of the A 1g and the E
1
2g vibration modes for MX 2 . Results follow the universal trend of thermal relaxation, which gives rise to the Debye temperature θ D , the
referential frequency ω L (1) and atomic cohesive energy E z , as shown in Table 22.3.
Figure 22.14 shows the BOLS reproduction of the temperature dependent A
3
g and
B 3g modes of SnS, SnS and GeSe films. They are different from the hexagonal honeycomb structure of MDCs. The SnS, SnS, and GeSe nanomaterials exhibit wrinkled
honeycomb structures. Because the Debye temperature for the SnS is greater than that
for SnSe and GeSe, the low temperature nonlinear range of the former is distinctly
larger than the latter.
The temperature dependent Raman frequency of the monolayer (ML), bilayer
(BL), and few-layer (FL) of MoTe 2 follows the BOLS approximation, see
Figs. 22.12a and 22.13a. Results show that atomic undercoordination shortens the
bond length and strengthen the bond energy. The E
1
2g mode undergoes a blueshift but
Table 22.3 Information derived from theoretical match to the Debye thermal decay of metal
dichalcogenides and metal monochalcogenides
Stimuli
ω A (1) (cm −1 )
ω E (1) (cm −1 )
E 0
(eV)
E z
(eV)
θ D (K)
ReSe 2
171.12
124.91
0.68
3.39
181
[136]
TaSe 2
232.12
206.73
–
5.23
150
[160]
MoTe 2
168.12 a /169.80 c
228.66 a /230.01 b /232.82 c 0.58
4.22
169
[161]
SnSe 2
181.11
117.32
0.53
4.45
170
[137]
SnS 2
293.52
–
4.16
3.51
136
[162]
GeSe 2
198.52
–
1.21
2.29
180
[129]
SnSe
133.85 d
88.46 e
0.49
0.83
204
[163]
SnS
150.13 d
84.96 e
0.69
0.80
270
[164]
GeSe
175.62 d
135.86 e
0.65
0.69
214
[165]
a Monolayer of the nanomaterials
b Bilayer of the nanomaterials
c Fewlayer of the nanomaterials
d A 3 g modes
e B 3g modes
22 Layered Structures
22.3.3.5 Debye Thermal Decay of Phonon Frequency
Figures 22.12 and 22.13 show the BOLS theory reproduction of the Debye thermal
decay of the A 1g and the E
1
2g vibration modes for MX 2 . Results follow the universal trend of thermal relaxation, which gives rise to the Debye temperature θ D , the
referential frequency ω L (1) and atomic cohesive energy E z , as shown in Table 22.3.
Figure 22.14 shows the BOLS reproduction of the temperature dependent A
3
g and
B 3g modes of SnS, SnS and GeSe films. They are different from the hexagonal honeycomb structure of MDCs. The SnS, SnS, and GeSe nanomaterials exhibit wrinkled
honeycomb structures. Because the Debye temperature for the SnS is greater than that
for SnSe and GeSe, the low temperature nonlinear range of the former is distinctly
larger than the latter.
The temperature dependent Raman frequency of the monolayer (ML), bilayer
(BL), and few-layer (FL) of MoTe 2 follows the BOLS approximation, see
Figs. 22.12a and 22.13a. Results show that atomic undercoordination shortens the
bond length and strengthen the bond energy. The E
1
2g mode undergoes a blueshift but
Table 22.3 Information derived from theoretical match to the Debye thermal decay of metal
dichalcogenides and metal monochalcogenides
Stimuli
ω A (1) (cm −1 )
ω E (1) (cm −1 )
E 0
(eV)
E z
(eV)
θ D (K)
ReSe 2
171.12
124.91
0.68
3.39
181
[136]
TaSe 2
232.12
206.73
–
5.23
150
[160]
MoTe 2
168.12 a /169.80 c
228.66 a /230.01 b /232.82 c 0.58
4.22
169
[161]
SnSe 2
181.11
117.32
0.53
4.45
170
[137]
SnS 2
293.52
–
4.16
3.51
136
[162]
GeSe 2
198.52
–
1.21
2.29
180
[129]
SnSe
133.85 d
88.46 e
0.49
0.83
204
[163]
SnS
150.13 d
84.96 e
0.69
0.80
270
[164]
GeSe
175.62 d
135.86 e
0.65
0.69
214
[165]
a Monolayer of the nanomaterials
b Bilayer of the nanomaterials
c Fewlayer of the nanomaterials
d A 3 g modes
e B 3g modes