

422
22 Layered Structures
1340
1350
1360
1370
2670
2685
2700
2715
2730
(cm
-1
)
Atomic-CN
2D
D
Graphene
3.0
3.5
4.0
4.5
5.0
5.5
3.0 3.5 4.0 4.5 5.0 5.5
1581
1582
1583
1584
1585
1586
1587
(cm
-1
)
Atomic-CN
1
2
3
4
5
6
468
469
470
471
472
cm -1
n
BOLS
BP-A 2
g
Graphene G
(a)
(b)
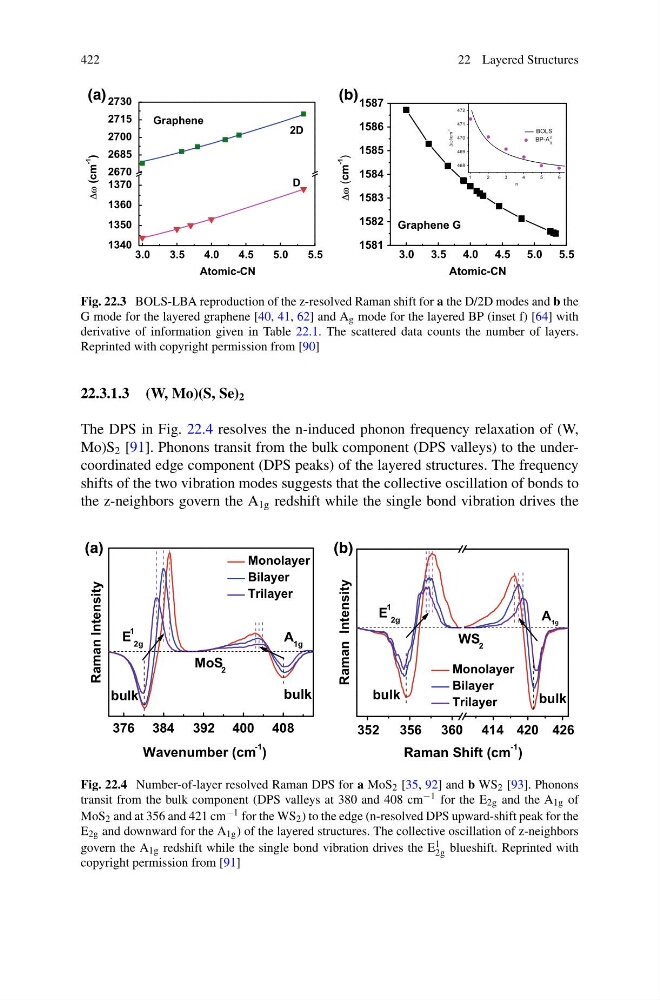
Fig. 22.3 BOLS-LBA reproduction of the z-resolved Raman shift for a the D/2D modes and b the
G mode for the layered graphene [40, 41, 62] and A g mode for the layered BP (inset f) [64] with
derivative of information given in Table 22.1. The scattered data counts the number of layers.
Reprinted with copyright permission from [90]
22.3.1.3 (W, Mo)(S, Se) 2
The DPS in Fig. 22.4 resolves the n-induced phonon frequency relaxation of (W,
Mo)S 2 [91]. Phonons transit from the bulk component (DPS valleys) to the undercoordinated edge component (DPS peaks) of the layered structures. The frequency
shifts of the two vibration modes suggests that the collective oscillation of bonds to
the z-neighbors govern the A 1g redshift while the single bond vibration drives the
Raman Intensity
Wavenumber (cm
-1
)
Monolayer
Bilayer
Trilayer
bulk
bulk
E
1
2g
A 1g
MoS 2
376 384 392 400 408
352
356 360 414 420 426
Raman Intensity
Raman Shift (cm
-1 )
Monolayer
Bilayer
Trilayer
E
1
2g
A 1g
WS 2
bulk
bulk
(a)
(b)
Fig. 22.4 Number-of-layer resolved Raman DPS for a MoS 2 [35, 92] and b WS 2 [93]. Phonons
transit from the bulk component (DPS valleys at 380 and 408 cm −1 for the E 2g and the A 1g of
MoS 2 and at 356 and 421 cm −1 for the WS 2 ) to the edge (n-resolved DPS upward-shift peak for the
E 2g and downward for the A 1g ) of the layered structures. The collective oscillation of z-neighbors
govern the A 1g redshift while the single bond vibration drives the E 1
2g blueshift. Reprinted with
copyright permission from [91]
22 Layered Structures
1340
1350
1360
1370
2670
2685
2700
2715
2730
(cm
-1
)
Atomic-CN
2D
D
Graphene
3.0
3.5
4.0
4.5
5.0
5.5
3.0 3.5 4.0 4.5 5.0 5.5
1581
1582
1583
1584
1585
1586
1587
(cm
-1
)
Atomic-CN
1
2
3
4
5
6
468
469
470
471
472
cm -1
n
BOLS
BP-A 2
g
Graphene G
(a)
(b)
Fig. 22.3 BOLS-LBA reproduction of the z-resolved Raman shift for a the D/2D modes and b the
G mode for the layered graphene [40, 41, 62] and A g mode for the layered BP (inset f) [64] with
derivative of information given in Table 22.1. The scattered data counts the number of layers.
Reprinted with copyright permission from [90]
22.3.1.3 (W, Mo)(S, Se) 2
The DPS in Fig. 22.4 resolves the n-induced phonon frequency relaxation of (W,
Mo)S 2 [91]. Phonons transit from the bulk component (DPS valleys) to the undercoordinated edge component (DPS peaks) of the layered structures. The frequency
shifts of the two vibration modes suggests that the collective oscillation of bonds to
the z-neighbors govern the A 1g redshift while the single bond vibration drives the
Raman Intensity
Wavenumber (cm
-1
)
Monolayer
Bilayer
Trilayer
bulk
bulk
E
1
2g
A 1g
MoS 2
376 384 392 400 408
352
356 360 414 420 426
Raman Intensity
Raman Shift (cm
-1 )
Monolayer
Bilayer
Trilayer
E
1
2g
A 1g
WS 2
bulk
bulk
(a)
(b)
Fig. 22.4 Number-of-layer resolved Raman DPS for a MoS 2 [35, 92] and b WS 2 [93]. Phonons
transit from the bulk component (DPS valleys at 380 and 408 cm −1 for the E 2g and the A 1g of
MoS 2 and at 356 and 421 cm −1 for the WS 2 ) to the edge (n-resolved DPS upward-shift peak for the
E 2g and downward for the A 1g ) of the layered structures. The collective oscillation of z-neighbors
govern the A 1g redshift while the single bond vibration drives the E 1
2g blueshift. Reprinted with
copyright permission from [91]