

20.3 Outline of Experimental Observations
379
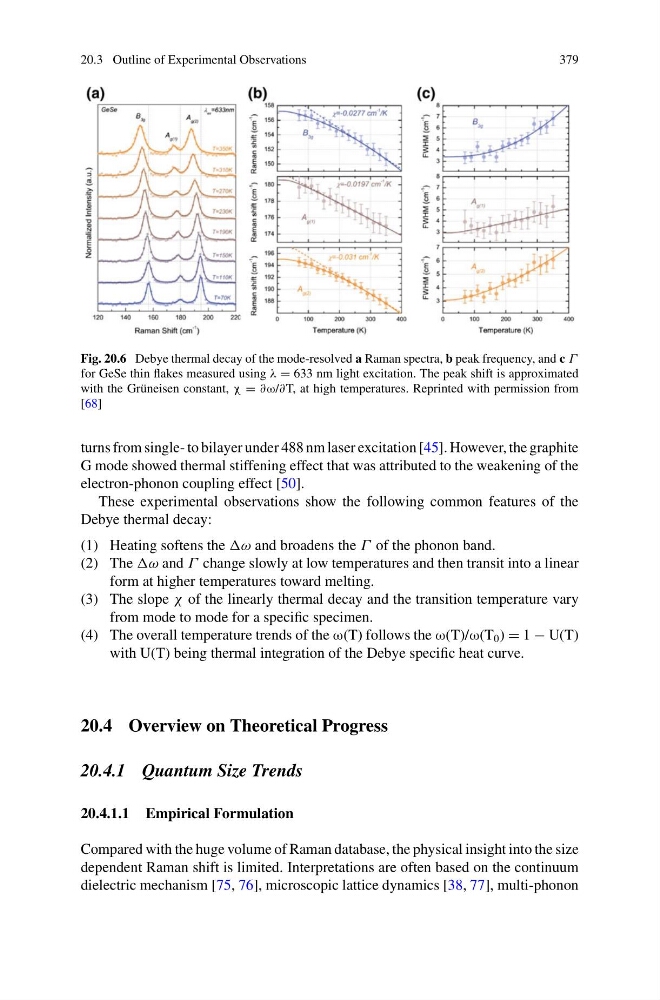
Fig. 20.6 Debye thermal decay of the mode-resolved a Raman spectra, b peak frequency, and c Γ
for GeSe thin flakes measured using λ = 633 nm light excitation. The peak shift is approximated
with the Grüneisen constant, χ = ∂ω/∂T, at high temperatures. Reprinted with permission from
[68]
turns from single- to bilayer under 488 nm laser excitation [45]. However, the graphite
G mode showed thermal stiffening effect that was attributed to the weakening of the
electron-phonon coupling effect [50].
These experimental observations show the following common features of the
Debye thermal decay:
(1) Heating softens the ω and broadens the Γ of the phonon band.
(2) The ω and Γ change slowly at low temperatures and then transit into a linear
form at higher temperatures toward melting.
(3) The slope χ of the linearly thermal decay and the transition temperature vary
from mode to mode for a specific specimen.
(4) The overall temperature trends of the ω(T) follows the ω(T)/ω(T 0 ) = 1 − U(T)
with U(T) being thermal integration of the Debye specific heat curve.
20.4 Overview on Theoretical Progress
20.4.1 Quantum Size Trends
20.4.1.1 Empirical Formulation
Compared with the huge volume of Raman database, the physical insight into the size
dependent Raman shift is limited. Interpretations are often based on the continuum
dielectric mechanism [75, 76], microscopic lattice dynamics [38, 77], multi-phonon
379
Fig. 20.6 Debye thermal decay of the mode-resolved a Raman spectra, b peak frequency, and c Γ
for GeSe thin flakes measured using λ = 633 nm light excitation. The peak shift is approximated
with the Grüneisen constant, χ = ∂ω/∂T, at high temperatures. Reprinted with permission from
[68]
turns from single- to bilayer under 488 nm laser excitation [45]. However, the graphite
G mode showed thermal stiffening effect that was attributed to the weakening of the
electron-phonon coupling effect [50].
These experimental observations show the following common features of the
Debye thermal decay:
(1) Heating softens the ω and broadens the Γ of the phonon band.
(2) The ω and Γ change slowly at low temperatures and then transit into a linear
form at higher temperatures toward melting.
(3) The slope χ of the linearly thermal decay and the transition temperature vary
from mode to mode for a specific specimen.
(4) The overall temperature trends of the ω(T) follows the ω(T)/ω(T 0 ) = 1 − U(T)
with U(T) being thermal integration of the Debye specific heat curve.
20.4 Overview on Theoretical Progress
20.4.1 Quantum Size Trends
20.4.1.1 Empirical Formulation
Compared with the huge volume of Raman database, the physical insight into the size
dependent Raman shift is limited. Interpretations are often based on the continuum
dielectric mechanism [75, 76], microscopic lattice dynamics [38, 77], multi-phonon