

378
20 Wonders of Multifield Lattice Oscillation
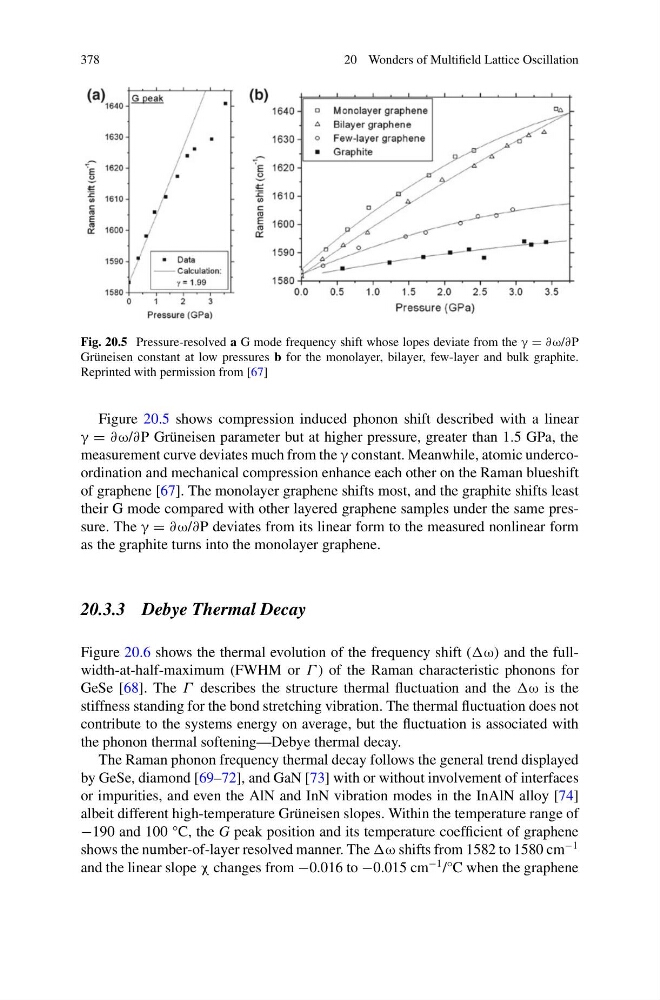
Fig. 20.5 Pressure-resolved a G mode frequency shift whose lopes deviate from the γ = ∂ω/∂P
Grüneisen constant at low pressures b for the monolayer, bilayer, few-layer and bulk graphite.
Reprinted with permission from [67]
Figure 20.5 shows compression induced phonon shift described with a linear
γ = ∂ω/∂P Grüneisen parameter but at higher pressure, greater than 1.5 GPa, the
measurement curve deviates much from the γ constant. Meanwhile, atomic undercoordination and mechanical compression enhance each other on the Raman blueshift
of graphene [67]. The monolayer graphene shifts most, and the graphite shifts least
their G mode compared with other layered graphene samples under the same pressure. The γ = ∂ω/∂P deviates from its linear form to the measured nonlinear form
as the graphite turns into the monolayer graphene.
20.3.3 Debye Thermal Decay
Figure 20.6 shows the thermal evolution of the frequency shift (ω) and the fullwidth-at-half-maximum (FWHM or Γ ) of the Raman characteristic phonons for
GeSe [68]. The Γ describes the structure thermal fluctuation and the ω is the
stiffness standing for the bond stretching vibration. The thermal fluctuation does not
contribute to the systems energy on average, but the fluctuation is associated with
the phonon thermal softening—Debye thermal decay.
The Raman phonon frequency thermal decay follows the general trend displayed
by GeSe, diamond [69–72], and GaN [73] with or without involvement of interfaces
or impurities, and even the AlN and InN vibration modes in the InAlN alloy [74]
albeit different high-temperature Grüneisen slopes. Within the temperature range of
−190 and 100 °C, the G peak position and its temperature coefficient of graphene
shows the number-of-layer resolved manner. The ω shifts from 1582 to 1580 cm
−1
and the linear slope χ changes from −0.016 to −0.015 cm
−1 /°C when the graphene
20 Wonders of Multifield Lattice Oscillation
Fig. 20.5 Pressure-resolved a G mode frequency shift whose lopes deviate from the γ = ∂ω/∂P
Grüneisen constant at low pressures b for the monolayer, bilayer, few-layer and bulk graphite.
Reprinted with permission from [67]
Figure 20.5 shows compression induced phonon shift described with a linear
γ = ∂ω/∂P Grüneisen parameter but at higher pressure, greater than 1.5 GPa, the
measurement curve deviates much from the γ constant. Meanwhile, atomic undercoordination and mechanical compression enhance each other on the Raman blueshift
of graphene [67]. The monolayer graphene shifts most, and the graphite shifts least
their G mode compared with other layered graphene samples under the same pressure. The γ = ∂ω/∂P deviates from its linear form to the measured nonlinear form
as the graphite turns into the monolayer graphene.
20.3.3 Debye Thermal Decay
Figure 20.6 shows the thermal evolution of the frequency shift (ω) and the fullwidth-at-half-maximum (FWHM or Γ ) of the Raman characteristic phonons for
GeSe [68]. The Γ describes the structure thermal fluctuation and the ω is the
stiffness standing for the bond stretching vibration. The thermal fluctuation does not
contribute to the systems energy on average, but the fluctuation is associated with
the phonon thermal softening—Debye thermal decay.
The Raman phonon frequency thermal decay follows the general trend displayed
by GeSe, diamond [69–72], and GaN [73] with or without involvement of interfaces
or impurities, and even the AlN and InN vibration modes in the InAlN alloy [74]
albeit different high-temperature Grüneisen slopes. Within the temperature range of
−190 and 100 °C, the G peak position and its temperature coefficient of graphene
shows the number-of-layer resolved manner. The ω shifts from 1582 to 1580 cm
−1
and the linear slope χ changes from −0.016 to −0.015 cm
−1 /°C when the graphene