

18.5 De-Hybridisation of Oxygen
355
I
I 0
00
(a. u)
B
A
C
D
B
A
7.5
10.0
12.5
15.0
C
D
(a)
C
D
B
A
C
D
B
A
C
D
B
A
-2.5
-2.0
-3.0
-3.5
7.5
10.0
12.5
15.0
z 0
(a.u)
(b)
STS feature
1
2
3
4
5
(c)
ImV(E)
(eV)
1.5669exp[(E-5)/10.43]
0.9019exp[(E-5)/6.27]
7.5
10.0
12.5
15.0
Energy (eV)
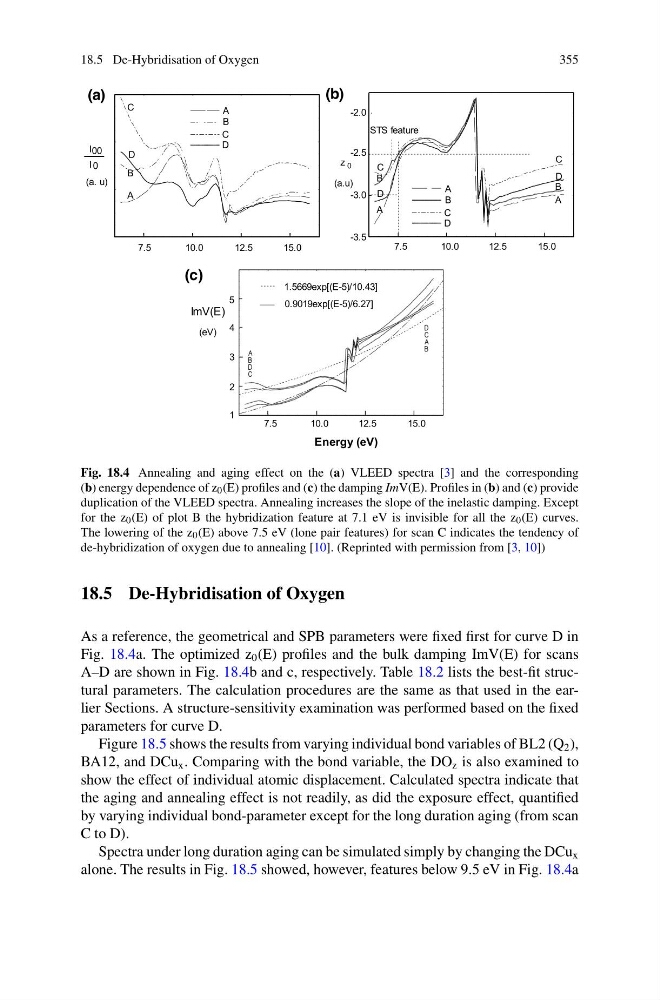
Fig. 18.4 Annealing and aging effect on the (a) VLEED spectra [3] and the corresponding
(b) energy dependence of z 0 (E) profiles and (c) the damping ImV(E). Profiles in (b) and (c) provide
duplication of the VLEED spectra. Annealing increases the slope of the inelastic damping. Except
for the z 0 (E) of plot B the hybridization feature at 7.1 eV is invisible for all the z 0 (E) curves.
The lowering of the z 0 (E) above 7.5 eV (lone pair features) for scan C indicates the tendency of
de-hybridization of oxygen due to annealing [10]. (Reprinted with permission from [3, 10])
18.5 De-Hybridisation of Oxygen
As a reference, the geometrical and SPB parameters were fixed first for curve D in
Fig. 18.4a. The optimized z 0 (E) profiles and the bulk damping ImV(E) for scans
A–D are shown in Fig. 18.4b and c, respectively. Table 18.2 lists the best-fit structural parameters. The calculation procedures are the same as that used in the earlier Sections. A structure-sensitivity examination was performed based on the fixed
parameters for curve D.
Figure 18.5 shows the results from varying individual bond variables of BL2 (Q 2 ),
BA12, and DCu x . Comparing with the bond variable, the DO z is also examined to
show the effect of individual atomic displacement. Calculated spectra indicate that
the aging and annealing effect is not readily, as did the exposure effect, quantified
by varying individual bond-parameter except for the long duration aging (from scan
C to D).
Spectra under long duration aging can be simulated simply by changing the DCu x
alone. The results in Fig. 18.5 showed, however, features below 9.5 eV in Fig. 18.4a
355
I
I 0
00
(a. u)
B
A
C
D
B
A
7.5
10.0
12.5
15.0
C
D
(a)
C
D
B
A
C
D
B
A
C
D
B
A
-2.5
-2.0
-3.0
-3.5
7.5
10.0
12.5
15.0
z 0
(a.u)
(b)
STS feature
1
2
3
4
5
(c)
ImV(E)
(eV)
1.5669exp[(E-5)/10.43]
0.9019exp[(E-5)/6.27]
7.5
10.0
12.5
15.0
Energy (eV)
Fig. 18.4 Annealing and aging effect on the (a) VLEED spectra [3] and the corresponding
(b) energy dependence of z 0 (E) profiles and (c) the damping ImV(E). Profiles in (b) and (c) provide
duplication of the VLEED spectra. Annealing increases the slope of the inelastic damping. Except
for the z 0 (E) of plot B the hybridization feature at 7.1 eV is invisible for all the z 0 (E) curves.
The lowering of the z 0 (E) above 7.5 eV (lone pair features) for scan C indicates the tendency of
de-hybridization of oxygen due to annealing [10]. (Reprinted with permission from [3, 10])
18.5 De-Hybridisation of Oxygen
As a reference, the geometrical and SPB parameters were fixed first for curve D in
Fig. 18.4a. The optimized z 0 (E) profiles and the bulk damping ImV(E) for scans
A–D are shown in Fig. 18.4b and c, respectively. Table 18.2 lists the best-fit structural parameters. The calculation procedures are the same as that used in the earlier Sections. A structure-sensitivity examination was performed based on the fixed
parameters for curve D.
Figure 18.5 shows the results from varying individual bond variables of BL2 (Q 2 ),
BA12, and DCu x . Comparing with the bond variable, the DO z is also examined to
show the effect of individual atomic displacement. Calculated spectra indicate that
the aging and annealing effect is not readily, as did the exposure effect, quantified
by varying individual bond-parameter except for the long duration aging (from scan
C to D).
Spectra under long duration aging can be simulated simply by changing the DCu x
alone. The results in Fig. 18.5 showed, however, features below 9.5 eV in Fig. 18.4a