

352
18 Four-Stage Cu 3 O 2 Bonding Dynamics
(a) z (E)
0
0
(b) z (E)
25L
30L
35L
50L
100L
200L
400L
600L
1000L
1500L
-2.5
-3.5
-2.5
-3.5
z 0
7.5
10.0 12.5 15.0
7.5 10.0 12.5 15.0
Energy (eV)
(a.u.)
(a.u.)
z 0
-2.5
-2.5
-2.5
-2.5
φ L
25L
30L
35L
50L
100L
(c): ImV(E, ) & ImV(E, 5.0)
200L
400L
600L
1000L
1500L
(d): ImV(E, ) & ImV(E, 5.0)
φ L
ImV(E)
(a.u.)
ImV(E)
(a.u.)
7.5
10.0 12.5 15.0
7.5 10.0 12.5 15.0
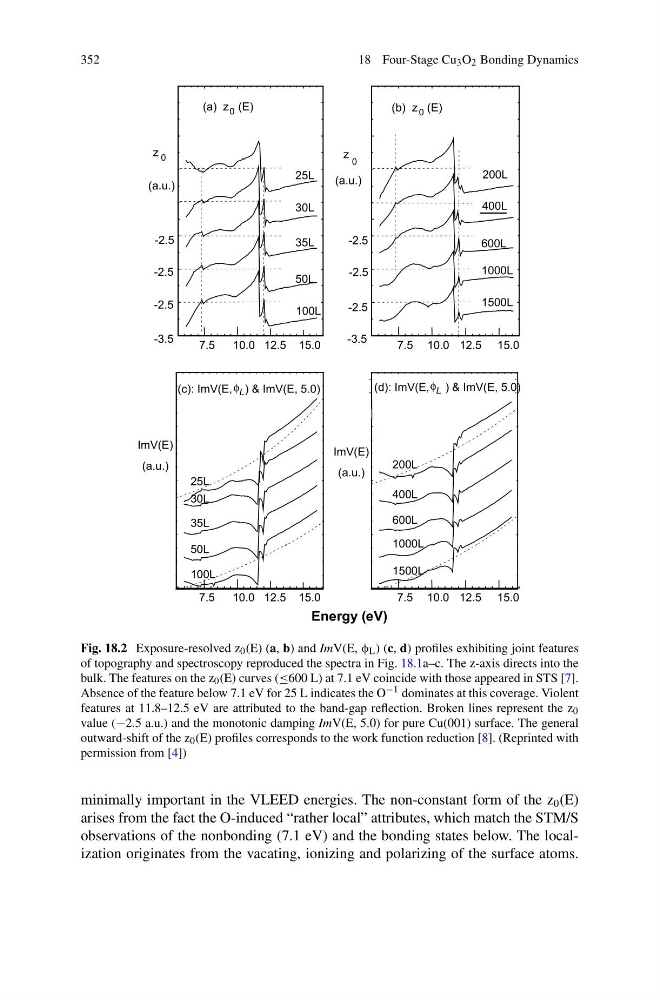
Fig. 18.2 Exposure-resolved z 0 (E) (a, b) and ImV(E, φ L ) (c, d) profiles exhibiting joint features
of topography and spectroscopy reproduced the spectra in Fig. 18.1a–c. The z-axis directs into the
bulk. The features on the z 0 (E) curves (≤600 L) at 7.1 eV coincide with those appeared in STS [7].
Absence of the feature below 7.1 eV for 25 L indicates the O −1 dominates at this coverage. Violent
features at 11.8–12.5 eV are attributed to the band-gap reflection. Broken lines represent the z 0
value (−2.5 a.u.) and the monotonic damping ImV(E, 5.0) for pure Cu(001) surface. The general
outward-shift of the z 0 (E) profiles corresponds to the work function reduction [8]. (Reprinted with
permission from [4])
minimally important in the VLEED energies. The non-constant form of the z 0 (E)
arises from the fact the O-induced “rather local” attributes, which match the STM/S
observations of the nonbonding (7.1 eV) and the bonding states below. The localization originates from the vacating, ionizing and polarizing of the surface atoms.
18 Four-Stage Cu 3 O 2 Bonding Dynamics
(a) z (E)
0
0
(b) z (E)
25L
30L
35L
50L
100L
200L
400L
600L
1000L
1500L
-2.5
-3.5
-2.5
-3.5
z 0
7.5
10.0 12.5 15.0
7.5 10.0 12.5 15.0
Energy (eV)
(a.u.)
(a.u.)
z 0
-2.5
-2.5
-2.5
-2.5
φ L
25L
30L
35L
50L
100L
(c): ImV(E, ) & ImV(E, 5.0)
200L
400L
600L
1000L
1500L
(d): ImV(E, ) & ImV(E, 5.0)
φ L
ImV(E)
(a.u.)
ImV(E)
(a.u.)
7.5
10.0 12.5 15.0
7.5 10.0 12.5 15.0
Fig. 18.2 Exposure-resolved z 0 (E) (a, b) and ImV(E, φ L ) (c, d) profiles exhibiting joint features
of topography and spectroscopy reproduced the spectra in Fig. 18.1a–c. The z-axis directs into the
bulk. The features on the z 0 (E) curves (≤600 L) at 7.1 eV coincide with those appeared in STS [7].
Absence of the feature below 7.1 eV for 25 L indicates the O −1 dominates at this coverage. Violent
features at 11.8–12.5 eV are attributed to the band-gap reflection. Broken lines represent the z 0
value (−2.5 a.u.) and the monotonic damping ImV(E, 5.0) for pure Cu(001) surface. The general
outward-shift of the z 0 (E) profiles corresponds to the work function reduction [8]. (Reprinted with
permission from [4])
minimally important in the VLEED energies. The non-constant form of the z 0 (E)
arises from the fact the O-induced “rather local” attributes, which match the STM/S
observations of the nonbonding (7.1 eV) and the bonding states below. The localization originates from the vacating, ionizing and polarizing of the surface atoms.