

16.1 Uniqueness of Solution
317
E=6.3 eV
E=7.3 eV
E=8.3 eV
λ
E=9.3 eV
E=10.3 eV
E=11.3 eV
z 0
A
B
A
B
A
B
A
B
A
B
(a.u.)
1.35
1.15
0.95
0.75
0.55
1.15
0.95
0.75
0.55
1.15
0.95
0.75
0.55
-4.0 -3.5 -3.0
-2.5 -2.0
-1.5
-3.5 -3.0 -2.5 -2.0 -1.5
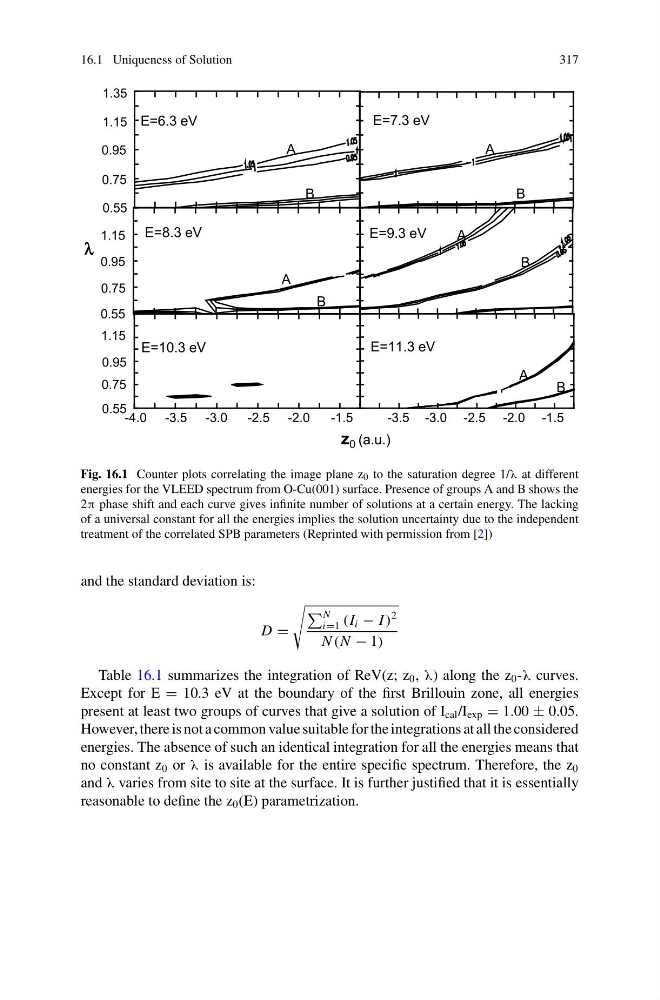
Fig. 16.1 Counter plots correlating the image plane z 0 to the saturation degree 1/λ at different
energies for the VLEED spectrum from O-Cu(001) surface. Presence of groups A and B shows the
2π phase shift and each curve gives infinite number of solutions at a certain energy. The lacking
of a universal constant for all the energies implies the solution uncertainty due to the independent
treatment of the correlated SPB parameters (Reprinted with permission from [2])
and the standard deviation is:
D =
N
i=1 (I i − I )
2
N (N − 1)
Table 16.1 summarizes the integration of ReV(z; z 0 , λ) along the z 0 -λ curves.
Except for E = 10.3 eV at the boundary of the first Brillouin zone, all energies
present at least two groups of curves that give a solution of I cal /I exp = 1.00 ± 0.05.
However, there is not a common value suitable for the integrations at all the considered
energies. The absence of such an identical integration for all the energies means that
no constant z 0 or λ is available for the entire specific spectrum. Therefore, the z 0
and λ varies from site to site at the surface. It is further justified that it is essentially
reasonable to define the z 0 (E) parametrization.
317
E=6.3 eV
E=7.3 eV
E=8.3 eV
λ
E=9.3 eV
E=10.3 eV
E=11.3 eV
z 0
A
B
A
B
A
B
A
B
A
B
(a.u.)
1.35
1.15
0.95
0.75
0.55
1.15
0.95
0.75
0.55
1.15
0.95
0.75
0.55
-4.0 -3.5 -3.0
-2.5 -2.0
-1.5
-3.5 -3.0 -2.5 -2.0 -1.5
Fig. 16.1 Counter plots correlating the image plane z 0 to the saturation degree 1/λ at different
energies for the VLEED spectrum from O-Cu(001) surface. Presence of groups A and B shows the
2π phase shift and each curve gives infinite number of solutions at a certain energy. The lacking
of a universal constant for all the energies implies the solution uncertainty due to the independent
treatment of the correlated SPB parameters (Reprinted with permission from [2])
and the standard deviation is:
D =
N
i=1 (I i − I )
2
N (N − 1)
Table 16.1 summarizes the integration of ReV(z; z 0 , λ) along the z 0 -λ curves.
Except for E = 10.3 eV at the boundary of the first Brillouin zone, all energies
present at least two groups of curves that give a solution of I cal /I exp = 1.00 ± 0.05.
However, there is not a common value suitable for the integrations at all the considered
energies. The absence of such an identical integration for all the energies means that
no constant z 0 or λ is available for the entire specific spectrum. Therefore, the z 0
and λ varies from site to site at the surface. It is further justified that it is essentially
reasonable to define the z 0 (E) parametrization.