

11.4 Electron Spectrometrics
229
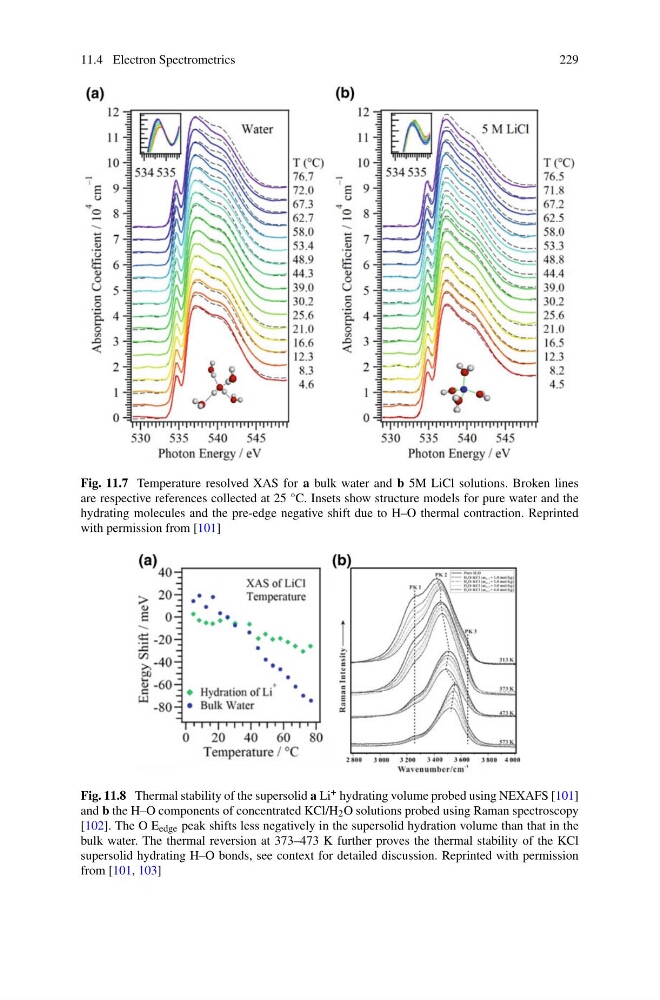
Fig. 11.7 Temperature resolved XAS for a bulk water and b 5M LiCl solutions. Broken lines
are respective references collected at 25 °C. Insets show structure models for pure water and the
hydrating molecules and the pre-edge negative shift due to H–O thermal contraction. Reprinted
with permission from [101]
Fig. 11.8 Thermal stability of the supersolid a Li + hydrating volume probed using NEXAFS [101]
and b the H–O components of concentrated KCl/H 2 O solutions probed using Raman spectroscopy
[102]. The O E edge peak shifts less negatively in the supersolid hydration volume than that in the
bulk water. The thermal reversion at 373–473 K further proves the thermal stability of the KCl
supersolid hydrating H–O bonds, see context for detailed discussion. Reprinted with permission
from [101, 103]
229
Fig. 11.7 Temperature resolved XAS for a bulk water and b 5M LiCl solutions. Broken lines
are respective references collected at 25 °C. Insets show structure models for pure water and the
hydrating molecules and the pre-edge negative shift due to H–O thermal contraction. Reprinted
with permission from [101]
Fig. 11.8 Thermal stability of the supersolid a Li + hydrating volume probed using NEXAFS [101]
and b the H–O components of concentrated KCl/H 2 O solutions probed using Raman spectroscopy
[102]. The O E edge peak shifts less negatively in the supersolid hydration volume than that in the
bulk water. The thermal reversion at 373–473 K further proves the thermal stability of the KCl
supersolid hydrating H–O bonds, see context for detailed discussion. Reprinted with permission
from [101, 103]