

174
8 Hetero-Coordinated Interfaces
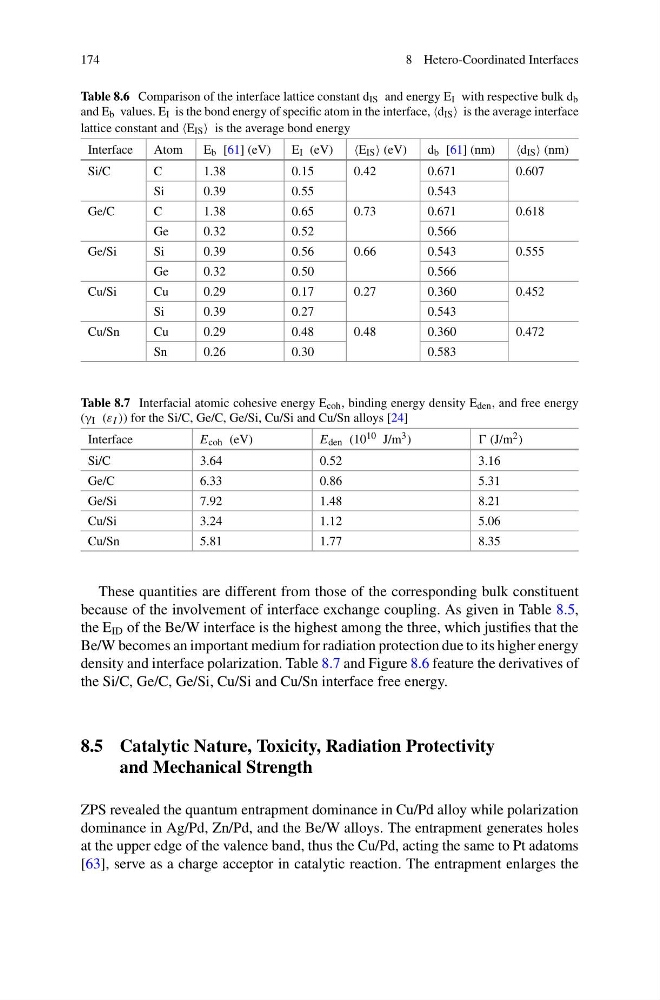
Table 8.6 Comparison of the interface lattice constant d IS and energy E I with respective bulk d b
and E b values. E I is the bond energy of specific atom in the interface, d IS is the average interface
lattice constant and E IS is the average bond energy
Interface
Atom
E b [61] (eV)
E I (eV)
E IS (eV)
d b [61] (nm)
d IS (nm)
Si/C
C
1.38
0.15
0.42
0.671
0.607
Si
0.39
0.55
0.543
Ge/C
C
1.38
0.65
0.73
0.671
0.618
Ge
0.32
0.52
0.566
Ge/Si
Si
0.39
0.56
0.66
0.543
0.555
Ge
0.32
0.50
0.566
Cu/Si
Cu
0.29
0.17
0.27
0.360
0.452
Si
0.39
0.27
0.543
Cu/Sn
Cu
0.29
0.48
0.48
0.360
0.472
Sn
0.26
0.30
0.583
Table 8.7 Interfacial atomic cohesive energy E coh , binding energy density E den , and free energy
(γ I (ε I )) for the Si/C, Ge/C, Ge/Si, Cu/Si and Cu/Sn alloys [24]
Interface
E coh (eV)
E den (10 10 J/m 3 )
(J/m 2 )
Si/C
3.64
0.52
3.16
Ge/C
6.33
0.86
5.31
Ge/Si
7.92
1.48
8.21
Cu/Si
3.24
1.12
5.06
Cu/Sn
5.81
1.77
8.35
These quantities are different from those of the corresponding bulk constituent
because of the involvement of interface exchange coupling. As given in Table 8.5,
the E ID of the Be/W interface is the highest among the three, which justifies that the
Be/W becomes an important medium for radiation protection due to its higher energy
density and interface polarization. Table 8.7 and Figure 8.6 feature the derivatives of
the Si/C, Ge/C, Ge/Si, Cu/Si and Cu/Sn interface free energy.
8.5 Catalytic Nature, Toxicity, Radiation Protectivity
and Mechanical Strength
ZPS revealed the quantum entrapment dominance in Cu/Pd alloy while polarization
dominance in Ag/Pd, Zn/Pd, and the Be/W alloys. The entrapment generates holes
at the upper edge of the valence band, thus the Cu/Pd, acting the same to Pt adatoms
[63], serve as a charge acceptor in catalytic reaction. The entrapment enlarges the
8 Hetero-Coordinated Interfaces
Table 8.6 Comparison of the interface lattice constant d IS and energy E I with respective bulk d b
and E b values. E I is the bond energy of specific atom in the interface, d IS is the average interface
lattice constant and E IS is the average bond energy
Interface
Atom
E b [61] (eV)
E I (eV)
E IS (eV)
d b [61] (nm)
d IS (nm)
Si/C
C
1.38
0.15
0.42
0.671
0.607
Si
0.39
0.55
0.543
Ge/C
C
1.38
0.65
0.73
0.671
0.618
Ge
0.32
0.52
0.566
Ge/Si
Si
0.39
0.56
0.66
0.543
0.555
Ge
0.32
0.50
0.566
Cu/Si
Cu
0.29
0.17
0.27
0.360
0.452
Si
0.39
0.27
0.543
Cu/Sn
Cu
0.29
0.48
0.48
0.360
0.472
Sn
0.26
0.30
0.583
Table 8.7 Interfacial atomic cohesive energy E coh , binding energy density E den , and free energy
(γ I (ε I )) for the Si/C, Ge/C, Ge/Si, Cu/Si and Cu/Sn alloys [24]
Interface
E coh (eV)
E den (10 10 J/m 3 )
(J/m 2 )
Si/C
3.64
0.52
3.16
Ge/C
6.33
0.86
5.31
Ge/Si
7.92
1.48
8.21
Cu/Si
3.24
1.12
5.06
Cu/Sn
5.81
1.77
8.35
These quantities are different from those of the corresponding bulk constituent
because of the involvement of interface exchange coupling. As given in Table 8.5,
the E ID of the Be/W interface is the highest among the three, which justifies that the
Be/W becomes an important medium for radiation protection due to its higher energy
density and interface polarization. Table 8.7 and Figure 8.6 feature the derivatives of
the Si/C, Ge/C, Ge/Si, Cu/Si and Cu/Sn interface free energy.
8.5 Catalytic Nature, Toxicity, Radiation Protectivity
and Mechanical Strength
ZPS revealed the quantum entrapment dominance in Cu/Pd alloy while polarization
dominance in Ag/Pd, Zn/Pd, and the Be/W alloys. The entrapment generates holes
at the upper edge of the valence band, thus the Cu/Pd, acting the same to Pt adatoms
[63], serve as a charge acceptor in catalytic reaction. The entrapment enlarges the