

170
8 Hetero-Coordinated Interfaces
281
282
283
284
285
286
Intensity (a.u.)
Element
Alloy
Residual
Binding energy (eV)
(a)
Si-C
C 1s
97
98
99
100
101
102
Intensity (a.u.)
Element
Alloy
Residual
Binding energy (eV)
(b)
Si-C
Si 2p
282
283
284
285
286
287
Intensity (a.u.)
Element
Alloy
Residual
Binding energy (eV)
(c)
Ge-C
C 1s
27
28
29
30
31
32
Ge-C
Ge 3d
Element
Alloy
Residual
Intensity (a.u.)
(d)
Binding energy (eV)
97
98
99
100
101
102
Intensity (a.u.)
Binding energy (eV)
Element
Alloy
Residual
Ge-Si
Si 2p
(e)
27
28
29
30
31
32
Intensity (a.u.)
Binding energy (eV)
Element
Alloy
Residual
Ge-Si
Ge 3d
(f)
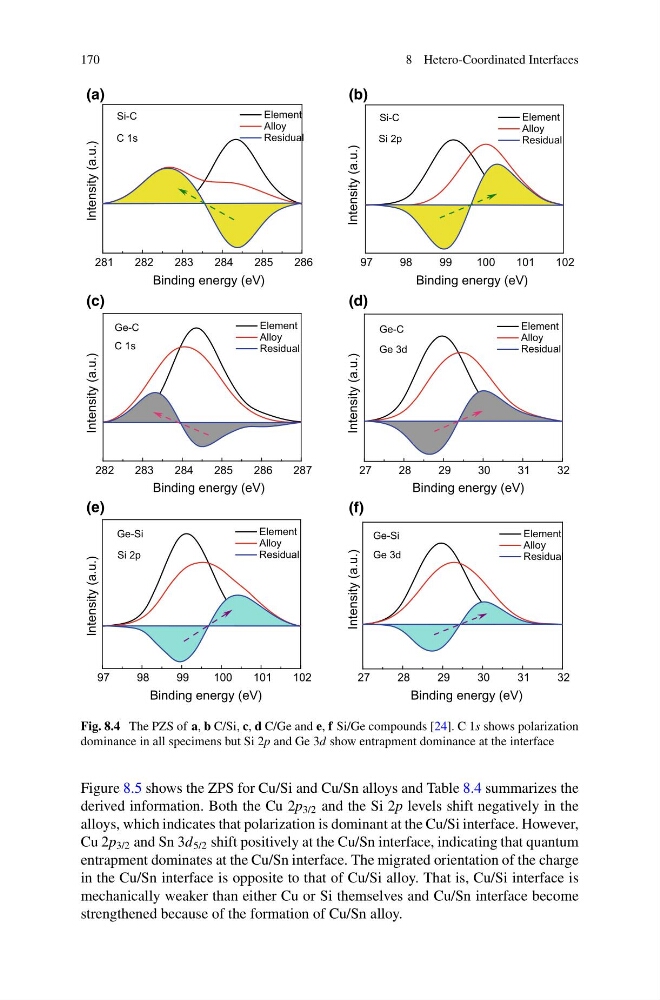
Fig. 8.4 The PZS of a, b C/Si, c, d C/Ge and e, f Si/Ge compounds [24]. C 1s shows polarization
dominance in all specimens but Si 2p and Ge 3d show entrapment dominance at the interface
Figure 8.5 shows the ZPS for Cu/Si and Cu/Sn alloys and Table 8.4 summarizes the
derived information. Both the Cu 2p 3/2 and the Si 2p levels shift negatively in the
alloys, which indicates that polarization is dominant at the Cu/Si interface. However,
Cu 2p 3/2 and Sn 3d 5/2 shift positively at the Cu/Sn interface, indicating that quantum
entrapment dominates at the Cu/Sn interface. The migrated orientation of the charge
in the Cu/Sn interface is opposite to that of Cu/Si alloy. That is, Cu/Si interface is
mechanically weaker than either Cu or Si themselves and Cu/Sn interface become
strengthened because of the formation of Cu/Sn alloy.
8 Hetero-Coordinated Interfaces
281
282
283
284
285
286
Intensity (a.u.)
Element
Alloy
Residual
Binding energy (eV)
(a)
Si-C
C 1s
97
98
99
100
101
102
Intensity (a.u.)
Element
Alloy
Residual
Binding energy (eV)
(b)
Si-C
Si 2p
282
283
284
285
286
287
Intensity (a.u.)
Element
Alloy
Residual
Binding energy (eV)
(c)
Ge-C
C 1s
27
28
29
30
31
32
Ge-C
Ge 3d
Element
Alloy
Residual
Intensity (a.u.)
(d)
Binding energy (eV)
97
98
99
100
101
102
Intensity (a.u.)
Binding energy (eV)
Element
Alloy
Residual
Ge-Si
Si 2p
(e)
27
28
29
30
31
32
Intensity (a.u.)
Binding energy (eV)
Element
Alloy
Residual
Ge-Si
Ge 3d
(f)
Fig. 8.4 The PZS of a, b C/Si, c, d C/Ge and e, f Si/Ge compounds [24]. C 1s shows polarization
dominance in all specimens but Si 2p and Ge 3d show entrapment dominance at the interface
Figure 8.5 shows the ZPS for Cu/Si and Cu/Sn alloys and Table 8.4 summarizes the
derived information. Both the Cu 2p 3/2 and the Si 2p levels shift negatively in the
alloys, which indicates that polarization is dominant at the Cu/Si interface. However,
Cu 2p 3/2 and Sn 3d 5/2 shift positively at the Cu/Sn interface, indicating that quantum
entrapment dominates at the Cu/Sn interface. The migrated orientation of the charge
in the Cu/Sn interface is opposite to that of Cu/Si alloy. That is, Cu/Si interface is
mechanically weaker than either Cu or Si themselves and Cu/Sn interface become
strengthened because of the formation of Cu/Sn alloy.