

8.1 Observations
165
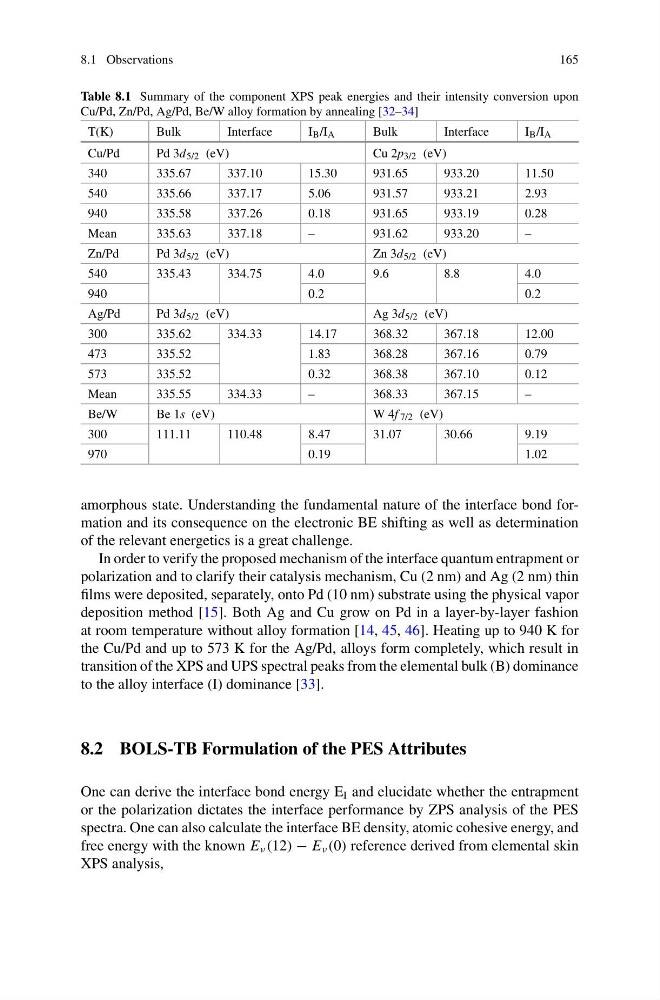
Table 8.1 Summary of the component XPS peak energies and their intensity conversion upon
Cu/Pd, Zn/Pd, Ag/Pd, Be/W alloy formation by annealing [32–34]
T(K)
Bulk
Interface
I B /I A
Bulk
Interface
I B /I A
Cu/Pd
Pd 3d 5/2 (eV)
Cu 2p 3/2 (eV)
340
335.67
337.10
15.30
931.65
933.20
11.50
540
335.66
337.17
5.06
931.57
933.21
2.93
940
335.58
337.26
0.18
931.65
933.19
0.28
Mean
335.63
337.18
–
931.62
933.20
–
Zn/Pd
Pd 3d 5/2 (eV)
Zn 3d 5/2 (eV)
540
335.43
334.75
4.0
9.6
8.8
4.0
940
0.2
0.2
Ag/Pd
Pd 3d 5/2 (eV)
Ag 3d 5/2 (eV)
300
335.62
334.33
14.17
368.32
367.18
12.00
473
335.52
1.83
368.28
367.16
0.79
573
335.52
0.32
368.38
367.10
0.12
Mean
335.55
334.33
–
368.33
367.15
–
Be/W
Be 1s (eV)
W 4f 7/2 (eV)
300
111.11
110.48
8.47
31.07
30.66
9.19
970
0.19
1.02
amorphous state. Understanding the fundamental nature of the interface bond formation and its consequence on the electronic BE shifting as well as determination
of the relevant energetics is a great challenge.
In order to verify the proposed mechanism of the interface quantum entrapment or
polarization and to clarify their catalysis mechanism, Cu (2 nm) and Ag (2 nm) thin
films were deposited, separately, onto Pd (10 nm) substrate using the physical vapor
deposition method [15]. Both Ag and Cu grow on Pd in a layer-by-layer fashion
at room temperature without alloy formation [14, 45, 46]. Heating up to 940 K for
the Cu/Pd and up to 573 K for the Ag/Pd, alloys form completely, which result in
transition of the XPS and UPS spectral peaks from the elemental bulk (B) dominance
to the alloy interface (I) dominance [33].
8.2 BOLS-TB Formulation of the PES Attributes
One can derive the interface bond energy E I and elucidate whether the entrapment
or the polarization dictates the interface performance by ZPS analysis of the PES
spectra. One can also calculate the interface BE density, atomic cohesive energy, and
free energy with the known E ν (12) − E ν (0) reference derived from elemental skin
XPS analysis,
165
Table 8.1 Summary of the component XPS peak energies and their intensity conversion upon
Cu/Pd, Zn/Pd, Ag/Pd, Be/W alloy formation by annealing [32–34]
T(K)
Bulk
Interface
I B /I A
Bulk
Interface
I B /I A
Cu/Pd
Pd 3d 5/2 (eV)
Cu 2p 3/2 (eV)
340
335.67
337.10
15.30
931.65
933.20
11.50
540
335.66
337.17
5.06
931.57
933.21
2.93
940
335.58
337.26
0.18
931.65
933.19
0.28
Mean
335.63
337.18
–
931.62
933.20
–
Zn/Pd
Pd 3d 5/2 (eV)
Zn 3d 5/2 (eV)
540
335.43
334.75
4.0
9.6
8.8
4.0
940
0.2
0.2
Ag/Pd
Pd 3d 5/2 (eV)
Ag 3d 5/2 (eV)
300
335.62
334.33
14.17
368.32
367.18
12.00
473
335.52
1.83
368.28
367.16
0.79
573
335.52
0.32
368.38
367.10
0.12
Mean
335.55
334.33
–
368.33
367.15
–
Be/W
Be 1s (eV)
W 4f 7/2 (eV)
300
111.11
110.48
8.47
31.07
30.66
9.19
970
0.19
1.02
amorphous state. Understanding the fundamental nature of the interface bond formation and its consequence on the electronic BE shifting as well as determination
of the relevant energetics is a great challenge.
In order to verify the proposed mechanism of the interface quantum entrapment or
polarization and to clarify their catalysis mechanism, Cu (2 nm) and Ag (2 nm) thin
films were deposited, separately, onto Pd (10 nm) substrate using the physical vapor
deposition method [15]. Both Ag and Cu grow on Pd in a layer-by-layer fashion
at room temperature without alloy formation [14, 45, 46]. Heating up to 940 K for
the Cu/Pd and up to 573 K for the Ag/Pd, alloys form completely, which result in
transition of the XPS and UPS spectral peaks from the elemental bulk (B) dominance
to the alloy interface (I) dominance [33].
8.2 BOLS-TB Formulation of the PES Attributes
One can derive the interface bond energy E I and elucidate whether the entrapment
or the polarization dictates the interface performance by ZPS analysis of the PES
spectra. One can also calculate the interface BE density, atomic cohesive energy, and
free energy with the known E ν (12) − E ν (0) reference derived from elemental skin
XPS analysis,