

6.4 Silver
111
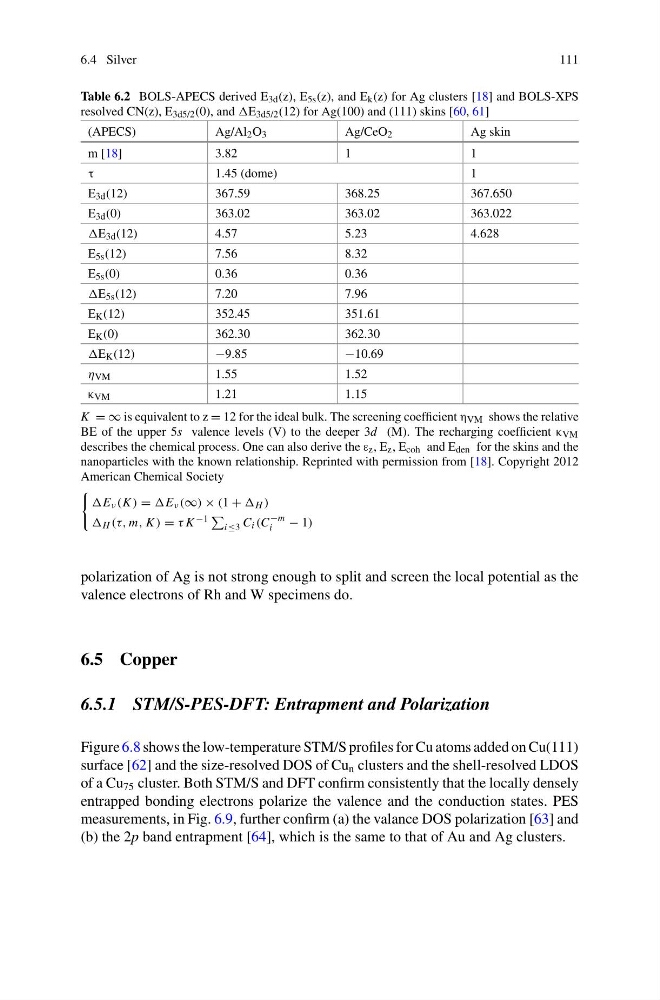
Table 6.2 BOLS-APECS derived E 3d (z), E 5s (z), and E k (z) for Ag clusters [18] and BOLS-XPS
resolved CN(z), E 3d5/2 (0), and E 3d5/2 (12) for Ag(100) and (111) skins [60, 61]
(APECS)
Ag/Al 2 O 3
Ag/CeO 2
Ag skin
m [18]
3.82
1
1
τ
1.45 (dome)
1
E 3d (12)
367.59
368.25
367.650
E 3d (0)
363.02
363.02
363.022
E 3d (12)
4.57
5.23
4.628
E 5s (12)
7.56
8.32
E 5s (0)
0.36
0.36
E 5s (12)
7.20
7.96
E K (12)
352.45
351.61
E K (0)
362.30
362.30
E K (12)
−9.85
−10.69
η VM
1.55
1.52
κ VM
1.21
1.15
K = ∞ is equivalent to z = 12 for the ideal bulk. The screening coefficient η VM shows the relative
BE of the upper 5s valence levels (V) to the deeper 3d (M). The recharging coefficient κ VM
describes the chemical process. One can also derive the ε z , E z , E coh and E den for the skins and the
nanoparticles with the known relationship. Reprinted with permission from [18]. Copyright 2012
American Chemical Society
E ν (K ) = E ν (∞) × (1 + H )
H (τ, m, K ) = τ K −1
i≤3 C i (C
−m
i
− 1)
polarization of Ag is not strong enough to split and screen the local potential as the
valence electrons of Rh and W specimens do.
6.5 Copper
6.5.1 STM/S-PES-DFT: Entrapment and Polarization
Figure 6.8 shows the low-temperature STM/S profiles for Cu atoms added on Cu(111)
surface [62] and the size-resolved DOS of Cu n clusters and the shell-resolved LDOS
of a Cu 75 cluster. Both STM/S and DFT confirm consistently that the locally densely
entrapped bonding electrons polarize the valence and the conduction states. PES
measurements, in Fig. 6.9, further confirm (a) the valance DOS polarization [63] and
(b) the 2p band entrapment [64], which is the same to that of Au and Ag clusters.
111
Table 6.2 BOLS-APECS derived E 3d (z), E 5s (z), and E k (z) for Ag clusters [18] and BOLS-XPS
resolved CN(z), E 3d5/2 (0), and E 3d5/2 (12) for Ag(100) and (111) skins [60, 61]
(APECS)
Ag/Al 2 O 3
Ag/CeO 2
Ag skin
m [18]
3.82
1
1
τ
1.45 (dome)
1
E 3d (12)
367.59
368.25
367.650
E 3d (0)
363.02
363.02
363.022
E 3d (12)
4.57
5.23
4.628
E 5s (12)
7.56
8.32
E 5s (0)
0.36
0.36
E 5s (12)
7.20
7.96
E K (12)
352.45
351.61
E K (0)
362.30
362.30
E K (12)
−9.85
−10.69
η VM
1.55
1.52
κ VM
1.21
1.15
K = ∞ is equivalent to z = 12 for the ideal bulk. The screening coefficient η VM shows the relative
BE of the upper 5s valence levels (V) to the deeper 3d (M). The recharging coefficient κ VM
describes the chemical process. One can also derive the ε z , E z , E coh and E den for the skins and the
nanoparticles with the known relationship. Reprinted with permission from [18]. Copyright 2012
American Chemical Society
E ν (K ) = E ν (∞) × (1 + H )
H (τ, m, K ) = τ K −1
i≤3 C i (C
−m
i
− 1)
polarization of Ag is not strong enough to split and screen the local potential as the
valence electrons of Rh and W specimens do.
6.5 Copper
6.5.1 STM/S-PES-DFT: Entrapment and Polarization
Figure 6.8 shows the low-temperature STM/S profiles for Cu atoms added on Cu(111)
surface [62] and the size-resolved DOS of Cu n clusters and the shell-resolved LDOS
of a Cu 75 cluster. Both STM/S and DFT confirm consistently that the locally densely
entrapped bonding electrons polarize the valence and the conduction states. PES
measurements, in Fig. 6.9, further confirm (a) the valance DOS polarization [63] and
(b) the 2p band entrapment [64], which is the same to that of Au and Ag clusters.