

106
6 Atomic Chains, Clusters, and Nanocrystals
0
2
4
6
8
0
10
20
30
40
50
m = 1, dot
plate
Au/TiO 2
Au/Octan
Au/Pt
Au/Thiol
(a)
Au-4f shift (%)
K
0
2
4
6
8
10
12
20
40
60
80
Inner potential depth / V
K
TEM measurement
BOLS
(b)
82 83 84 85 86 87 88 89 90
4f 7/2
4f 5/2
I(a.u.)
BE(ev)
1.2ML-Bulk
1.0ML-Bulk
0.8ML-Bulk
0.6ML-Bulk
(c)
z = 2.69
0
1
2
3
4
5
6
7
8
5d 3/2
I(a.u.)
BE(eV)
1.2ML-Bulk
1.0ML-Bulk
0.8ML-Bulk
0.6ML-Bulk
(d)
5d 5/2
Δ
Δ
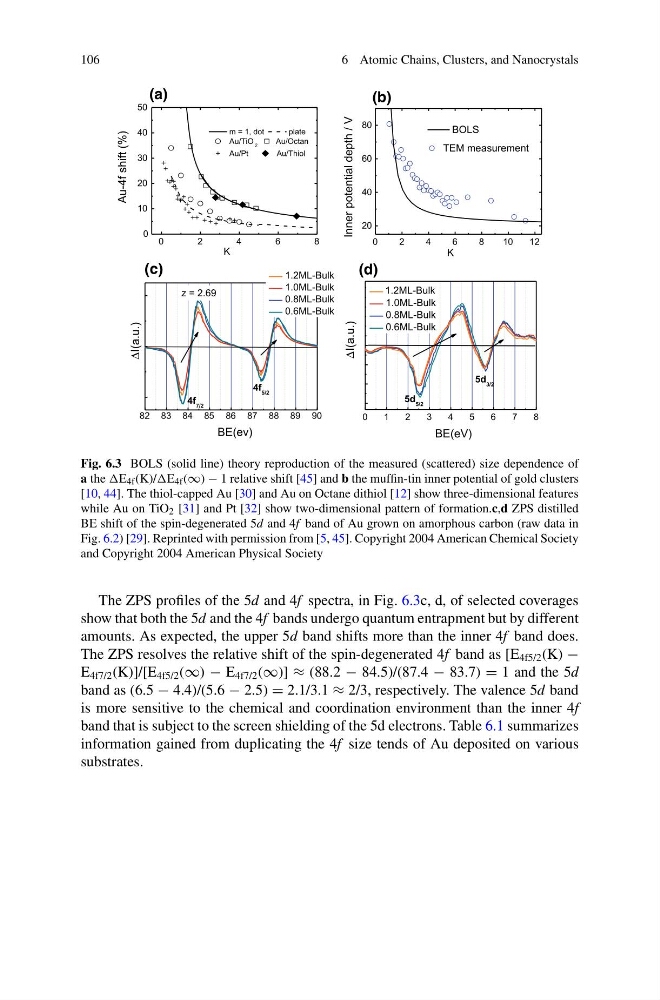
Fig. 6.3 BOLS (solid line) theory reproduction of the measured (scattered) size dependence of
a the 4f (K)/ 4f (∞) − 1 relative shift [45] and b the muffin-tin inner potential of gold clusters
[10, 44]. The thiol-capped Au [30] and Au on Octane dithiol [12] show three-dimensional features
while Au on TiO 2 [31] and Pt [32] show two-dimensional pattern of formation.c,d ZPS distilled
BE shift of the spin-degenerated 5d and 4f band of Au grown on amorphous carbon (raw data in
Fig. 6.2) [29]. Reprinted with permission from [5, 45]. Copyright 2004 American Chemical Society
and Copyright 2004 American Physical Society
The ZPS profiles of the 5d and 4f spectra, in Fig. 6.3c, d, of selected coverages
show that both the 5d and the 4f bands undergo quantum entrapment but by different
amounts. As expected, the upper 5d band shifts more than the inner 4f band does.
The ZPS resolves the relative shift of the spin-degenerated 4f band as [E 4f5/2 (K) −
E 4f7/2 (K)]/[E 4f5/2 (∞) − E 4f7/2 (∞)] ≈ (88.2 − 84.5)/(87.4 − 83.7) = 1 and the 5d
band as (6.5 − 4.4)/(5.6 − 2.5) = 2.1/3.1 ≈ 2/3, respectively. The valence 5d band
is more sensitive to the chemical and coordination environment than the inner 4f
band that is subject to the screen shielding of the 5d electrons. Table 6.1 summarizes
information gained from duplicating the 4f size tends of Au deposited on various
substrates.
6 Atomic Chains, Clusters, and Nanocrystals
0
2
4
6
8
0
10
20
30
40
50
m = 1, dot
plate
Au/TiO 2
Au/Octan
Au/Pt
Au/Thiol
(a)
Au-4f shift (%)
K
0
2
4
6
8
10
12
20
40
60
80
Inner potential depth / V
K
TEM measurement
BOLS
(b)
82 83 84 85 86 87 88 89 90
4f 7/2
4f 5/2
I(a.u.)
BE(ev)
1.2ML-Bulk
1.0ML-Bulk
0.8ML-Bulk
0.6ML-Bulk
(c)
z = 2.69
0
1
2
3
4
5
6
7
8
5d 3/2
I(a.u.)
BE(eV)
1.2ML-Bulk
1.0ML-Bulk
0.8ML-Bulk
0.6ML-Bulk
(d)
5d 5/2
Δ
Δ
Fig. 6.3 BOLS (solid line) theory reproduction of the measured (scattered) size dependence of
a the 4f (K)/ 4f (∞) − 1 relative shift [45] and b the muffin-tin inner potential of gold clusters
[10, 44]. The thiol-capped Au [30] and Au on Octane dithiol [12] show three-dimensional features
while Au on TiO 2 [31] and Pt [32] show two-dimensional pattern of formation.c,d ZPS distilled
BE shift of the spin-degenerated 5d and 4f band of Au grown on amorphous carbon (raw data in
Fig. 6.2) [29]. Reprinted with permission from [5, 45]. Copyright 2004 American Chemical Society
and Copyright 2004 American Physical Society
The ZPS profiles of the 5d and 4f spectra, in Fig. 6.3c, d, of selected coverages
show that both the 5d and the 4f bands undergo quantum entrapment but by different
amounts. As expected, the upper 5d band shifts more than the inner 4f band does.
The ZPS resolves the relative shift of the spin-degenerated 4f band as [E 4f5/2 (K) −
E 4f7/2 (K)]/[E 4f5/2 (∞) − E 4f7/2 (∞)] ≈ (88.2 − 84.5)/(87.4 − 83.7) = 1 and the 5d
band as (6.5 − 4.4)/(5.6 − 2.5) = 2.1/3.1 ≈ 2/3, respectively. The valence 5d band
is more sensitive to the chemical and coordination environment than the inner 4f
band that is subject to the screen shielding of the 5d electrons. Table 6.1 summarizes
information gained from duplicating the 4f size tends of Au deposited on various
substrates.