

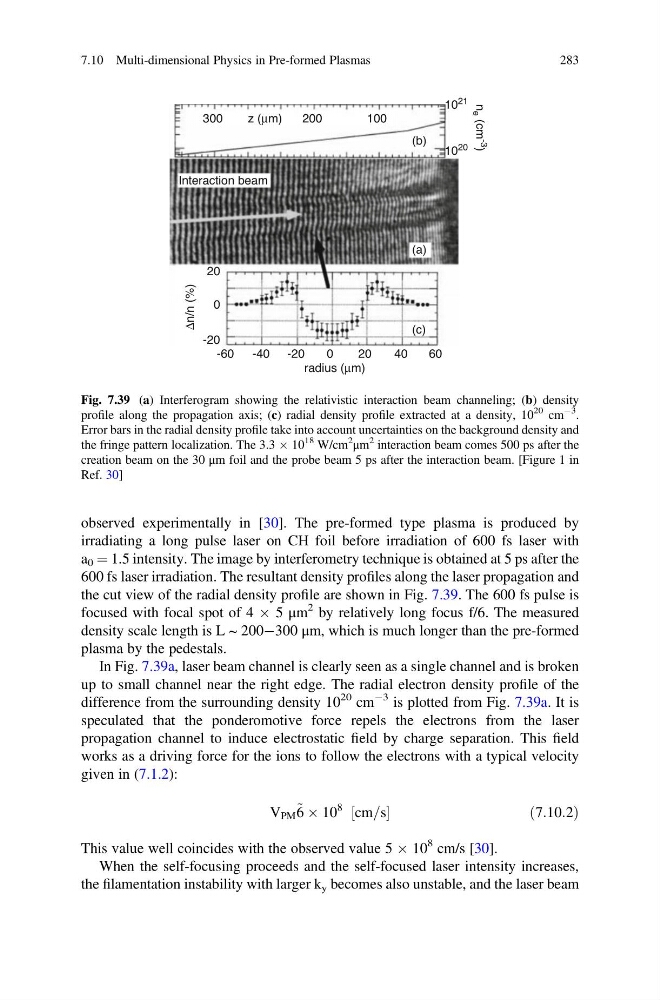
observed experimentally in [30]. The pre-formed type plasma is produced by
irradiating a long pulse laser on CH foil before irradiation of 600 fs laser with
a 0 ¼ 1.5 intensity. The image by interferometry technique is obtained at 5 ps after the
600 fs laser irradiation. The resultant density profiles along the laser propagation and
the cut view of the radial density profile are shown in Fig. 7.39. The 600 fs pulse is
focused with focal spot of 4 Â 5 μm
2 by relatively long focus f/6. The measured
density scale length is L ~ 200À300 μm, which is much longer than the pre-formed
plasma by the pedestals.
In Fig. 7.39a, laser beam channel is clearly seen as a single channel and is broken
up to small channel near the right edge. The radial electron density profile of the
difference from the surrounding density 10
20 cm
À3 is plotted from Fig. 7.39a. It is
speculated that the ponderomotive force repels the electrons from the laser
propagation channel to induce electrostatic field by charge separation. This field
works as a driving force for the ions to follow the electrons with a typical velocity
given in (7.1.2):
V PM ~ 6 Â 10
8 cm=s
½
ð7:10:2Þ
This value well coincides with the observed value 5 Â 10
8 cm/s [30].
When the self-focusing proceeds and the self-focused laser intensity increases,
the filamentation instability with larger k y becomes also unstable, and the laser beam
300
20
Δn/n (%)
0
0
-20
-20
20
40
60
-40
-60
200
Interaction beam
n e (cm -3 )
100
(b)
(a)
(c)
10
21
10
20
z (μm)
radius (μm)
Fig. 7.39 (a) Interferogram showing the relativistic interaction beam channeling; (b) density
profile along the propagation axis; (c) radial density profile extracted at a density, 10
20 cm
À3
.
Error bars in the radial density profile take into account uncertainties on the background density and
the fringe pattern localization. The 3.3 Â 10
18 W/cm
2
μm
2 interaction beam comes 500 ps after the
creation beam on the 30 μm foil and the probe beam 5 ps after the interaction beam. [Figure 1 in
Ref. 30]
7.10 Multi-dimensional Physics in Pre-formed Plasmas
283
irradiating a long pulse laser on CH foil before irradiation of 600 fs laser with
a 0 ¼ 1.5 intensity. The image by interferometry technique is obtained at 5 ps after the
600 fs laser irradiation. The resultant density profiles along the laser propagation and
the cut view of the radial density profile are shown in Fig. 7.39. The 600 fs pulse is
focused with focal spot of 4 Â 5 μm
2 by relatively long focus f/6. The measured
density scale length is L ~ 200À300 μm, which is much longer than the pre-formed
plasma by the pedestals.
In Fig. 7.39a, laser beam channel is clearly seen as a single channel and is broken
up to small channel near the right edge. The radial electron density profile of the
difference from the surrounding density 10
20 cm
À3 is plotted from Fig. 7.39a. It is
speculated that the ponderomotive force repels the electrons from the laser
propagation channel to induce electrostatic field by charge separation. This field
works as a driving force for the ions to follow the electrons with a typical velocity
given in (7.1.2):
V PM ~ 6 Â 10
8 cm=s
½
ð7:10:2Þ
This value well coincides with the observed value 5 Â 10
8 cm/s [30].
When the self-focusing proceeds and the self-focused laser intensity increases,
the filamentation instability with larger k y becomes also unstable, and the laser beam
300
20
Δn/n (%)
0
0
-20
-20
20
40
60
-40
-60
200
Interaction beam
n e (cm -3 )
100
(b)
(a)
(c)
10
21
10
20
z (μm)
radius (μm)
Fig. 7.39 (a) Interferogram showing the relativistic interaction beam channeling; (b) density
profile along the propagation axis; (c) radial density profile extracted at a density, 10
20 cm
À3
.
Error bars in the radial density profile take into account uncertainties on the background density and
the fringe pattern localization. The 3.3 Â 10
18 W/cm
2
μm
2 interaction beam comes 500 ps after the
creation beam on the 30 μm foil and the probe beam 5 ps after the interaction beam. [Figure 1 in
Ref. 30]
7.10 Multi-dimensional Physics in Pre-formed Plasmas
283