

classical absorption is effective to generate pre-formed plasma before the main pulse.
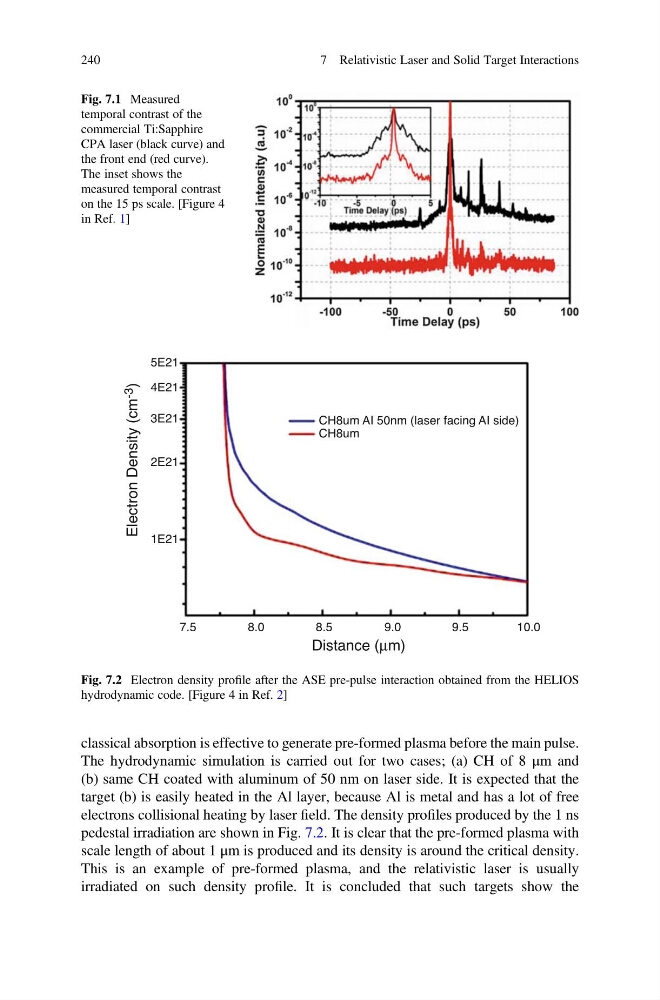
The hydrodynamic simulation is carried out for two cases; (a) CH of 8 μm and
(b) same CH coated with aluminum of 50 nm on laser side. It is expected that the
target (b) is easily heated in the Al layer, because Al is metal and has a lot of free
electrons collisional heating by laser field. The density profiles produced by the 1 ns
pedestal irradiation are shown in Fig. 7.2. It is clear that the pre-formed plasma with
scale length of about 1 μm is produced and its density is around the critical density.
This is an example of pre-formed plasma, and the relativistic laser is usually
irradiated on such density profile. It is concluded that such targets show the
Fig. 7.1 Measured
temporal contrast of the
commercial Ti:Sapphire
CPA laser (black curve) and
the front end (red curve).
The inset shows the
measured temporal contrast
on the 15 ps scale. [Figure 4
in Ref. 1]
5E21
4E21
3E21
2E21
Distance (μm)
Electron Density (cm -3
)
1E21
CH8um AI 50nm (laser facing AI side)
CH8um
7.5
8.0
8.5
9.0
9.5
10.0
Fig. 7.2 Electron density profile after the ASE pre-pulse interaction obtained from the HELIOS
hydrodynamic code. [Figure 4 in Ref. 2]
240
7 Relativistic Laser and Solid Target Interactions
The hydrodynamic simulation is carried out for two cases; (a) CH of 8 μm and
(b) same CH coated with aluminum of 50 nm on laser side. It is expected that the
target (b) is easily heated in the Al layer, because Al is metal and has a lot of free
electrons collisional heating by laser field. The density profiles produced by the 1 ns
pedestal irradiation are shown in Fig. 7.2. It is clear that the pre-formed plasma with
scale length of about 1 μm is produced and its density is around the critical density.
This is an example of pre-formed plasma, and the relativistic laser is usually
irradiated on such density profile. It is concluded that such targets show the
Fig. 7.1 Measured
temporal contrast of the
commercial Ti:Sapphire
CPA laser (black curve) and
the front end (red curve).
The inset shows the
measured temporal contrast
on the 15 ps scale. [Figure 4
in Ref. 1]
5E21
4E21
3E21
2E21
Distance (μm)
Electron Density (cm -3
)
1E21
CH8um AI 50nm (laser facing AI side)
CH8um
7.5
8.0
8.5
9.0
9.5
10.0
Fig. 7.2 Electron density profile after the ASE pre-pulse interaction obtained from the HELIOS
hydrodynamic code. [Figure 4 in Ref. 2]
240
7 Relativistic Laser and Solid Target Interactions