

V ¼ 0,
d
dt
V ¼ 0 t ¼ 0
ð
Þ
After an initial phase, the asymptotic solution of (3.6.5) for the liner density
profile
n e x
ð Þ ¼ 1 þ x=L
ð
Þ n cr
ÀL < x
ð
Þ
ð 3:9:9Þ
is obtained in the form:
V t, x
ð Þ ¼
V d
2
x
2L
À1
sin
x
2L
ωt
cos 1 þ
x
2L
ωt
h
i
ð3:9:10Þ
Time evolution of this solution is plotted in Fig. 3.31. It is seen in Fig. 3.31 that the
wave propagates from high density- to low-density region (right to left), and the
oscillation amplitude increases monotonically with time. In addition, effective
wavelength decreases near the critical point x ¼ 0. This solution (3.9.10) gives the
following amplitude of the oscillation velocity in time at x ¼ 0:
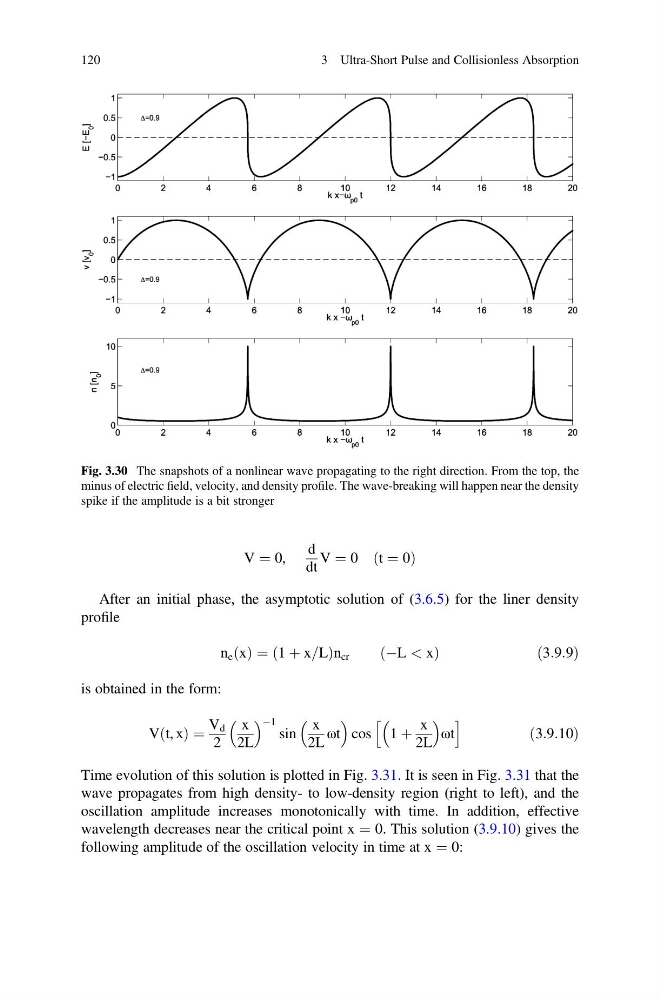
Fig. 3.30 The snapshots of a nonlinear wave propagating to the right direction. From the top, the
minus of electric field, velocity, and density profile. The wave-breaking will happen near the density
spike if the amplitude is a bit stronger
120
3 Ultra-Short Pulse and Collisionless Absorption
d
dt
V ¼ 0 t ¼ 0
ð
Þ
After an initial phase, the asymptotic solution of (3.6.5) for the liner density
profile
n e x
ð Þ ¼ 1 þ x=L
ð
Þ n cr
ÀL < x
ð
Þ
ð 3:9:9Þ
is obtained in the form:
V t, x
ð Þ ¼
V d
2
x
2L
À1
sin
x
2L
ωt
cos 1 þ
x
2L
ωt
h
i
ð3:9:10Þ
Time evolution of this solution is plotted in Fig. 3.31. It is seen in Fig. 3.31 that the
wave propagates from high density- to low-density region (right to left), and the
oscillation amplitude increases monotonically with time. In addition, effective
wavelength decreases near the critical point x ¼ 0. This solution (3.9.10) gives the
following amplitude of the oscillation velocity in time at x ¼ 0:
Fig. 3.30 The snapshots of a nonlinear wave propagating to the right direction. From the top, the
minus of electric field, velocity, and density profile. The wave-breaking will happen near the density
spike if the amplitude is a bit stronger
120
3 Ultra-Short Pulse and Collisionless Absorption