

propagates only from the critical point to vacuum, and it gains energy
from the plasma wave. This is also resonant coupling of the plasma waves and
electromagnetic waves.
3.8.1 Absorption Rate and Pump Depletion
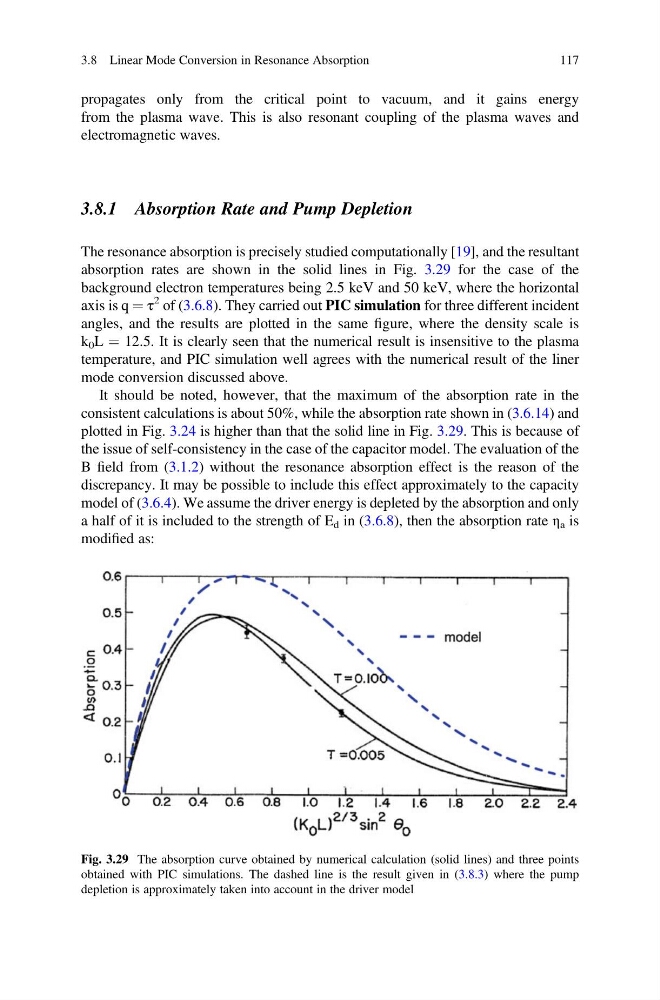
The resonance absorption is precisely studied computationally [19], and the resultant
absorption rates are shown in the solid lines in Fig. 3.29 for the case of the
background electron temperatures being 2.5 keV and 50 keV, where the horizontal
axis is q ¼ τ
2 of (3.6.8). They carried out PIC simulation for three different incident
angles, and the results are plotted in the same figure, where the density scale is
k 0 L ¼ 12.5. It is clearly seen that the numerical result is insensitive to the plasma
temperature, and PIC simulation well agrees with the numerical result of the liner
mode conversion discussed above.
It should be noted, however, that the maximum of the absorption rate in the
consistent calculations is about 50%, while the absorption rate shown in (3.6.14) and
plotted in Fig. 3.24 is higher than that the solid line in Fig. 3.29. This is because of
the issue of self-consistency in the case of the capacitor model. The evaluation of the
B field from (3.1.2) without the resonance absorption effect is the reason of the
discrepancy. It may be possible to include this effect approximately to the capacity
model of (3.6.4). We assume the driver energy is depleted by the absorption and only
a half of it is included to the strength of E d in (3.6.8), then the absorption rate η a is
modified as:
Fig. 3.29 The absorption curve obtained by numerical calculation (solid lines) and three points
obtained with PIC simulations. The dashed line is the result given in (3.8.3) where the pump
depletion is approximately taken into account in the driver model
3.8 Linear Mode Conversion in Resonance Absorption
117
from the plasma wave. This is also resonant coupling of the plasma waves and
electromagnetic waves.
3.8.1 Absorption Rate and Pump Depletion
The resonance absorption is precisely studied computationally [19], and the resultant
absorption rates are shown in the solid lines in Fig. 3.29 for the case of the
background electron temperatures being 2.5 keV and 50 keV, where the horizontal
axis is q ¼ τ
2 of (3.6.8). They carried out PIC simulation for three different incident
angles, and the results are plotted in the same figure, where the density scale is
k 0 L ¼ 12.5. It is clearly seen that the numerical result is insensitive to the plasma
temperature, and PIC simulation well agrees with the numerical result of the liner
mode conversion discussed above.
It should be noted, however, that the maximum of the absorption rate in the
consistent calculations is about 50%, while the absorption rate shown in (3.6.14) and
plotted in Fig. 3.24 is higher than that the solid line in Fig. 3.29. This is because of
the issue of self-consistency in the case of the capacitor model. The evaluation of the
B field from (3.1.2) without the resonance absorption effect is the reason of the
discrepancy. It may be possible to include this effect approximately to the capacity
model of (3.6.4). We assume the driver energy is depleted by the absorption and only
a half of it is included to the strength of E d in (3.6.8), then the absorption rate η a is
modified as:
Fig. 3.29 The absorption curve obtained by numerical calculation (solid lines) and three points
obtained with PIC simulations. The dashed line is the result given in (3.8.3) where the pump
depletion is approximately taken into account in the driver model
3.8 Linear Mode Conversion in Resonance Absorption
117