

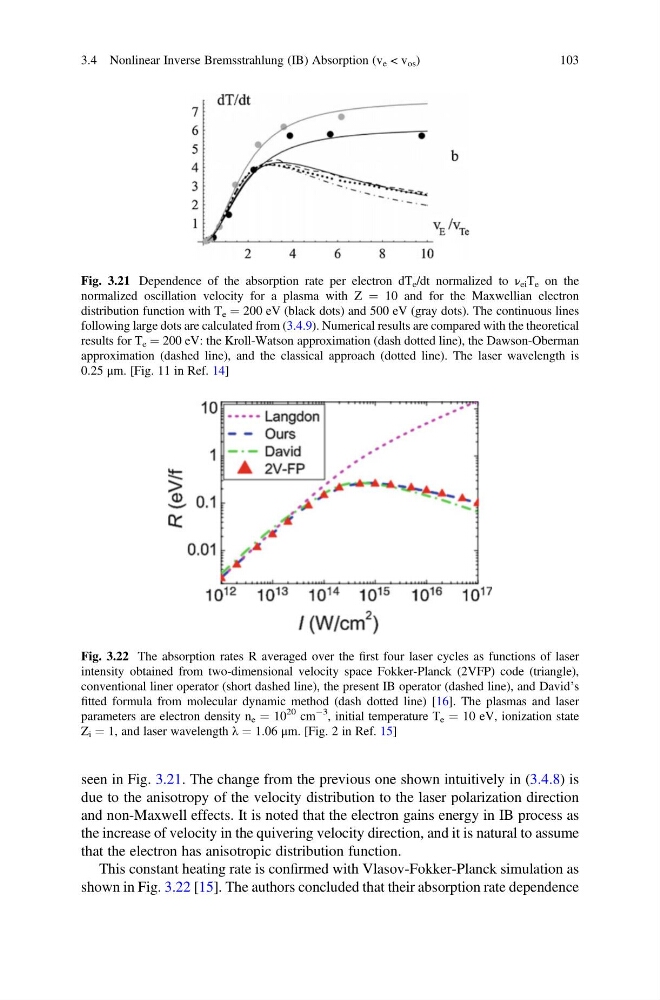
seen in Fig. 3.21. The change from the previous one shown intuitively in (3.4.8) is
due to the anisotropy of the velocity distribution to the laser polarization direction
and non-Maxwell effects. It is noted that the electron gains energy in IB process as
the increase of velocity in the quivering velocity direction, and it is natural to assume
that the electron has anisotropic distribution function.
This constant heating rate is confirmed with Vlasov-Fokker-Planck simulation as
shown in Fig. 3.22 [15]. The authors concluded that their absorption rate dependence
Fig. 3.21 Dependence of the absorption rate per electron dT e /dt normalized to ν ei T e on the
normalized oscillation velocity for a plasma with Z ¼ 10 and for the Maxwellian electron
distribution function with T e ¼ 200 eV (black dots) and 500 eV (gray dots). The continuous lines
following large dots are calculated from (3.4.9). Numerical results are compared with the theoretical
results for T e ¼ 200 eV: the Kroll-Watson approximation (dash dotted line), the Dawson-Oberman
approximation (dashed line), and the classical approach (dotted line). The laser wavelength is
0.25 μm. [Fig. 11 in Ref. 14]
Fig. 3.22 The absorption rates R averaged over the first four laser cycles as functions of laser
intensity obtained from two-dimensional velocity space Fokker-Planck (2VFP) code (triangle),
conventional liner operator (short dashed line), the present IB operator (dashed line), and David’s
fitted formula from molecular dynamic method (dash dotted line) [16]. The plasmas and laser
parameters are electron density n e ¼ 10
20 cm
À3
, initial temperature T e ¼ 10 eV, ionization state
Z i ¼ 1, and laser wavelength λ ¼ 1.06 μm. [Fig. 2 in Ref. 15]
3.4 Nonlinear Inverse Bremsstrahlung (IB) Absorption (v e < v os )
103
due to the anisotropy of the velocity distribution to the laser polarization direction
and non-Maxwell effects. It is noted that the electron gains energy in IB process as
the increase of velocity in the quivering velocity direction, and it is natural to assume
that the electron has anisotropic distribution function.
This constant heating rate is confirmed with Vlasov-Fokker-Planck simulation as
shown in Fig. 3.22 [15]. The authors concluded that their absorption rate dependence
Fig. 3.21 Dependence of the absorption rate per electron dT e /dt normalized to ν ei T e on the
normalized oscillation velocity for a plasma with Z ¼ 10 and for the Maxwellian electron
distribution function with T e ¼ 200 eV (black dots) and 500 eV (gray dots). The continuous lines
following large dots are calculated from (3.4.9). Numerical results are compared with the theoretical
results for T e ¼ 200 eV: the Kroll-Watson approximation (dash dotted line), the Dawson-Oberman
approximation (dashed line), and the classical approach (dotted line). The laser wavelength is
0.25 μm. [Fig. 11 in Ref. 14]
Fig. 3.22 The absorption rates R averaged over the first four laser cycles as functions of laser
intensity obtained from two-dimensional velocity space Fokker-Planck (2VFP) code (triangle),
conventional liner operator (short dashed line), the present IB operator (dashed line), and David’s
fitted formula from molecular dynamic method (dash dotted line) [16]. The plasmas and laser
parameters are electron density n e ¼ 10
20 cm
À3
, initial temperature T e ¼ 10 eV, ionization state
Z i ¼ 1, and laser wavelength λ ¼ 1.06 μm. [Fig. 2 in Ref. 15]
3.4 Nonlinear Inverse Bremsstrahlung (IB) Absorption (v e < v os )
103