

peak for the case of laser intensity 10
15 W/cm
2 , where the peak absorption is
observed.
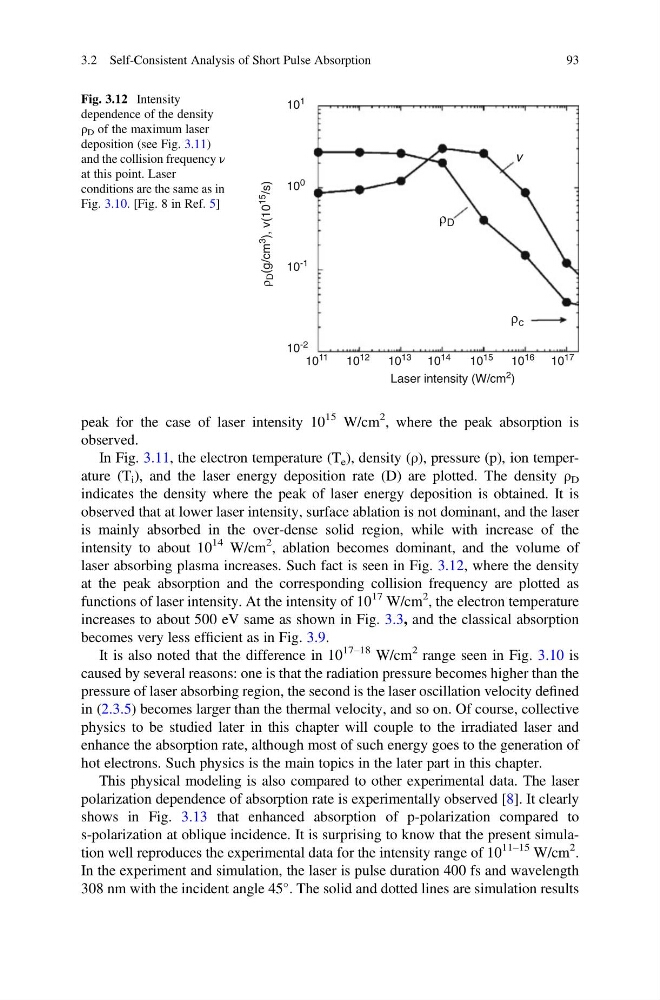
In Fig. 3.11, the electron temperature (T e ), density (ρ), pressure (p), ion temperature (T i ), and the laser energy deposition rate (D) are plotted. The density ρ D
indicates the density where the peak of laser energy deposition is obtained. It is
observed that at lower laser intensity, surface ablation is not dominant, and the laser
is mainly absorbed in the over-dense solid region, while with increase of the
intensity to about 10
14 W/cm
2 , ablation becomes dominant, and the volume of
laser absorbing plasma increases. Such fact is seen in Fig. 3.12, where the density
at the peak absorption and the corresponding collision frequency are plotted as
functions of laser intensity. At the intensity of 10
17 W/cm
2 , the electron temperature
increases to about 500 eV same as shown in Fig. 3.3, and the classical absorption
becomes very less efficient as in Fig. 3.9.
It is also noted that the difference in 10
17–18 W/cm
2 range seen in Fig. 3.10 is
caused by several reasons: one is that the radiation pressure becomes higher than the
pressure of laser absorbing region, the second is the laser oscillation velocity defined
in (2.3.5) becomes larger than the thermal velocity, and so on. Of course, collective
physics to be studied later in this chapter will couple to the irradiated laser and
enhance the absorption rate, although most of such energy goes to the generation of
hot electrons. Such physics is the main topics in the later part in this chapter.
This physical modeling is also compared to other experimental data. The laser
polarization dependence of absorption rate is experimentally observed [8]. It clearly
shows in Fig. 3.13 that enhanced absorption of p-polarization compared to
s-polarization at oblique incidence. It is surprising to know that the present simulation well reproduces the experimental data for the intensity range of 10
11–15 W/cm
2 .
In the experiment and simulation, the laser is pulse duration 400 fs and wavelength
308 nm with the incident angle 45
. The solid and dotted lines are simulation results
10
1
10
0
v
10
-1
10
-2
10
11
10
12
10
13
Laser intensity (W/cm
2 )
10
14
10
15
10
16
10
17
ρ D
ρ
D (g/cm 3
), v(10 15
/s)
ρ c
Fig. 3.12 Intensity
dependence of the density
ρ D of the maximum laser
deposition (see Fig. 3.11)
and the collision frequency ν
at this point. Laser
conditions are the same as in
Fig. 3.10. [Fig. 8 in Ref. 5]
3.2 Self-Consistent Analysis of Short Pulse Absorption
93
15 W/cm
2 , where the peak absorption is
observed.
In Fig. 3.11, the electron temperature (T e ), density (ρ), pressure (p), ion temperature (T i ), and the laser energy deposition rate (D) are plotted. The density ρ D
indicates the density where the peak of laser energy deposition is obtained. It is
observed that at lower laser intensity, surface ablation is not dominant, and the laser
is mainly absorbed in the over-dense solid region, while with increase of the
intensity to about 10
14 W/cm
2 , ablation becomes dominant, and the volume of
laser absorbing plasma increases. Such fact is seen in Fig. 3.12, where the density
at the peak absorption and the corresponding collision frequency are plotted as
functions of laser intensity. At the intensity of 10
17 W/cm
2 , the electron temperature
increases to about 500 eV same as shown in Fig. 3.3, and the classical absorption
becomes very less efficient as in Fig. 3.9.
It is also noted that the difference in 10
17–18 W/cm
2 range seen in Fig. 3.10 is
caused by several reasons: one is that the radiation pressure becomes higher than the
pressure of laser absorbing region, the second is the laser oscillation velocity defined
in (2.3.5) becomes larger than the thermal velocity, and so on. Of course, collective
physics to be studied later in this chapter will couple to the irradiated laser and
enhance the absorption rate, although most of such energy goes to the generation of
hot electrons. Such physics is the main topics in the later part in this chapter.
This physical modeling is also compared to other experimental data. The laser
polarization dependence of absorption rate is experimentally observed [8]. It clearly
shows in Fig. 3.13 that enhanced absorption of p-polarization compared to
s-polarization at oblique incidence. It is surprising to know that the present simulation well reproduces the experimental data for the intensity range of 10
11–15 W/cm
2 .
In the experiment and simulation, the laser is pulse duration 400 fs and wavelength
308 nm with the incident angle 45
. The solid and dotted lines are simulation results
10
1
10
0
v
10
-1
10
-2
10
11
10
12
10
13
Laser intensity (W/cm
2 )
10
14
10
15
10
16
10
17
ρ D
ρ
D (g/cm 3
), v(10 15
/s)
ρ c
Fig. 3.12 Intensity
dependence of the density
ρ D of the maximum laser
deposition (see Fig. 3.11)
and the collision frequency ν
at this point. Laser
conditions are the same as in
Fig. 3.10. [Fig. 8 in Ref. 5]
3.2 Self-Consistent Analysis of Short Pulse Absorption
93