

approximation over short timescales). A crude estimate demonstrates quickly that
the effect is significant and needs to be accounted for through detailed modelling.
By simplifying to a spherical object accelerated by a mass ejection, dM N /dt, at a
velocity, v ej , acting in the plane orthogonal to the rotation axis at a distance, r ej away
from it, the angular acceleration is given by
dΩ N
dt
¼
5
2
v ej r ej
dM N
dt
1
M N r 2
N
:
ð2:34Þ
For reasonable numbers in this highly simplified case, the change in angular
velocity corresponds to changes in the rotation period of the order of seconds per day
for 2 km-sized nuclei at even moderate levels of activity. It should be clear that the
surface area to volume (and therefore mass) ratio increases as the object radius
decreases and hence the effect of outgassing on the rotational properties must
increase as the object gets smaller unless changes in Z i occur.
Steckloff and Samarasinha (2018) have provided a more rigorous, general,
approach and derived
dΩ N
dt
¼
3
4π
Zm H2O v ej
f tan
ρ N r N
2
ð2:35Þ
where is the average molecular outflow velocity of the sublimating water
molecules in the direction normal to the surface, Z is the average production rate in
[molecule m
À2 s
À1 ] of water molecules of mass, m H2O , and f tan is the effective
tangential fraction of the theoretical volatile flux at zero solar phase angle that
contributes to a net torque. The bars in Eq. 2.35 indicate use of orbitally averaged
values. In both equations one can see the dependencies upon ejection velocity, mass
loss rate and the mass of the nucleus.
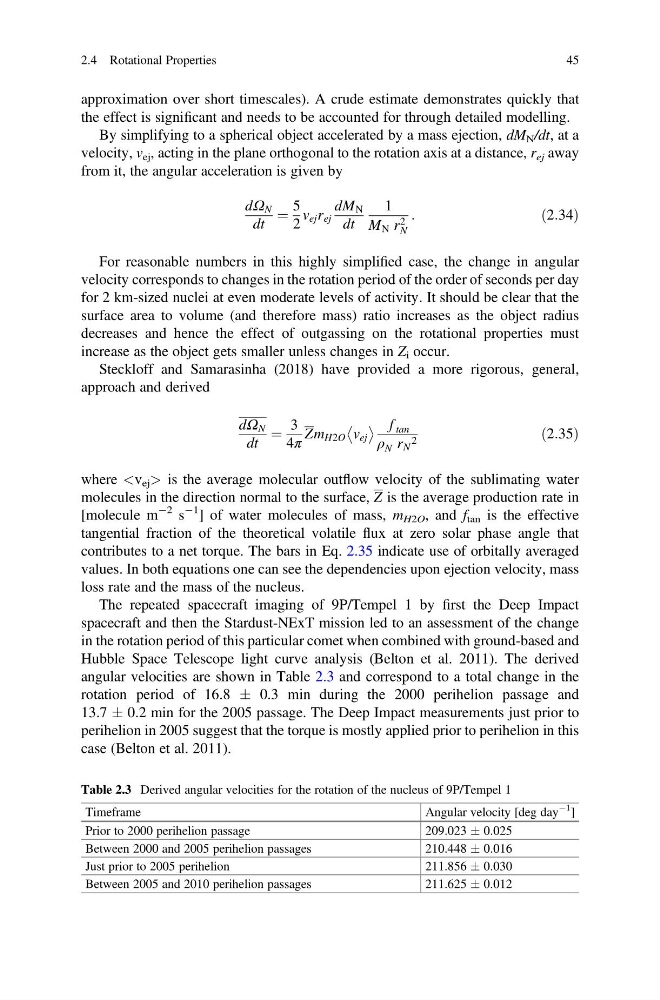
The repeated spacecraft imaging of 9P/Tempel 1 by first the Deep Impact
spacecraft and then the Stardust-NExT mission led to an assessment of the change
in the rotation period of this particular comet when combined with ground-based and
Hubble Space Telescope light curve analysis (Belton et al. 2011). The derived
angular velocities are shown in Table 2.3 and correspond to a total change in the
rotation period of 16.8 Æ 0.3 min during the 2000 perihelion passage and
13.7 Æ 0.2 min for the 2005 passage. The Deep Impact measurements just prior to
perihelion in 2005 suggest that the torque is mostly applied prior to perihelion in this
case (Belton et al. 2011).
Table 2.3 Derived angular velocities for the rotation of the nucleus of 9P/Tempel 1
Timeframe
Angular velocity [deg day
À1
]
Prior to 2000 perihelion passage
209.023 Æ 0.025
Between 2000 and 2005 perihelion passages
210.448 Æ 0.016
Just prior to 2005 perihelion
211.856 Æ 0.030
Between 2005 and 2010 perihelion passages
211.625 Æ 0.012
2.4 Rotational Properties
45
the effect is significant and needs to be accounted for through detailed modelling.
By simplifying to a spherical object accelerated by a mass ejection, dM N /dt, at a
velocity, v ej , acting in the plane orthogonal to the rotation axis at a distance, r ej away
from it, the angular acceleration is given by
dΩ N
dt
¼
5
2
v ej r ej
dM N
dt
1
M N r 2
N
:
ð2:34Þ
For reasonable numbers in this highly simplified case, the change in angular
velocity corresponds to changes in the rotation period of the order of seconds per day
for 2 km-sized nuclei at even moderate levels of activity. It should be clear that the
surface area to volume (and therefore mass) ratio increases as the object radius
decreases and hence the effect of outgassing on the rotational properties must
increase as the object gets smaller unless changes in Z i occur.
Steckloff and Samarasinha (2018) have provided a more rigorous, general,
approach and derived
dΩ N
dt
¼
3
4π
Zm H2O v ej
f tan
ρ N r N
2
ð2:35Þ
where
molecules in the direction normal to the surface, Z is the average production rate in
[molecule m
À2 s
À1 ] of water molecules of mass, m H2O , and f tan is the effective
tangential fraction of the theoretical volatile flux at zero solar phase angle that
contributes to a net torque. The bars in Eq. 2.35 indicate use of orbitally averaged
values. In both equations one can see the dependencies upon ejection velocity, mass
loss rate and the mass of the nucleus.
The repeated spacecraft imaging of 9P/Tempel 1 by first the Deep Impact
spacecraft and then the Stardust-NExT mission led to an assessment of the change
in the rotation period of this particular comet when combined with ground-based and
Hubble Space Telescope light curve analysis (Belton et al. 2011). The derived
angular velocities are shown in Table 2.3 and correspond to a total change in the
rotation period of 16.8 Æ 0.3 min during the 2000 perihelion passage and
13.7 Æ 0.2 min for the 2005 passage. The Deep Impact measurements just prior to
perihelion in 2005 suggest that the torque is mostly applied prior to perihelion in this
case (Belton et al. 2011).
Table 2.3 Derived angular velocities for the rotation of the nucleus of 9P/Tempel 1
Timeframe
Angular velocity [deg day
À1
]
Prior to 2000 perihelion passage
209.023 Æ 0.025
Between 2000 and 2005 perihelion passages
210.448 Æ 0.016
Just prior to 2005 perihelion
211.856 Æ 0.030
Between 2005 and 2010 perihelion passages
211.625 Æ 0.012
2.4 Rotational Properties
45