

where M N is the mass of the nucleus. The equations must be consistent with the
measured total gas production rates so that, at any one time,
Q g t
ð Þ ¼
X
i
x i Z i t
ð Þσ i t
ð Þ
ð1:27Þ
where Q g (t) is the gas production rate at time, t, on the comet’s orbit determined
through observation.
There are a large number of free parameters in this approach but it is a clear
improvement over the Marsden approach because the g(r h ) term is replaced by a
physical description rather than empirical constants. Such a physical description
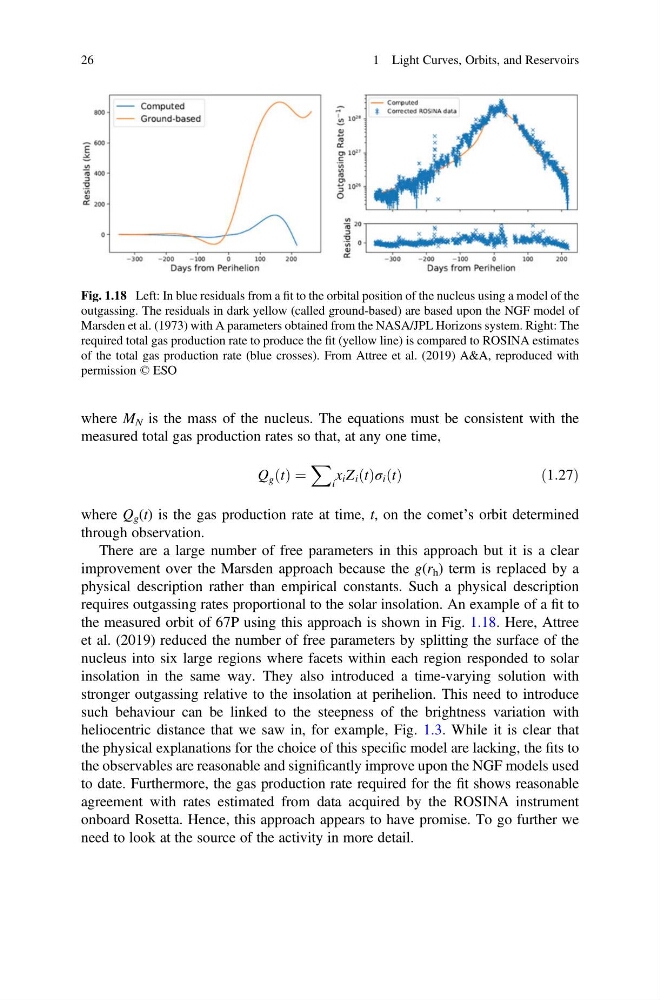
requires outgassing rates proportional to the solar insolation. An example of a fit to
the measured orbit of 67P using this approach is shown in Fig. 1.18. Here, Attree
et al. (2019) reduced the number of free parameters by splitting the surface of the
nucleus into six large regions where facets within each region responded to solar
insolation in the same way. They also introduced a time-varying solution with
stronger outgassing relative to the insolation at perihelion. This need to introduce
such behaviour can be linked to the steepness of the brightness variation with
heliocentric distance that we saw in, for example, Fig. 1.3. While it is clear that
the physical explanations for the choice of this specific model are lacking, the fits to
the observables are reasonable and significantly improve upon the NGF models used
to date. Furthermore, the gas production rate required for the fit shows reasonable
agreement with rates estimated from data acquired by the ROSINA instrument
onboard Rosetta. Hence, this approach appears to have promise. To go further we
need to look at the source of the activity in more detail.
Fig. 1.18 Left: In blue residuals from a fit to the orbital position of the nucleus using a model of the
outgassing. The residuals in dark yellow (called ground-based) are based upon the NGF model of
Marsden et al. (1973) with A parameters obtained from the NASA/JPL Horizons system. Right: The
required total gas production rate to produce the fit (yellow line) is compared to ROSINA estimates
of the total gas production rate (blue crosses). From Attree et al. (2019) A&A, reproduced with
permission © ESO
26
1 Light Curves, Orbits, and Reservoirs
measured total gas production rates so that, at any one time,
Q g t
ð Þ ¼
X
i
x i Z i t
ð Þσ i t
ð Þ
ð1:27Þ
where Q g (t) is the gas production rate at time, t, on the comet’s orbit determined
through observation.
There are a large number of free parameters in this approach but it is a clear
improvement over the Marsden approach because the g(r h ) term is replaced by a
physical description rather than empirical constants. Such a physical description
requires outgassing rates proportional to the solar insolation. An example of a fit to
the measured orbit of 67P using this approach is shown in Fig. 1.18. Here, Attree
et al. (2019) reduced the number of free parameters by splitting the surface of the
nucleus into six large regions where facets within each region responded to solar
insolation in the same way. They also introduced a time-varying solution with
stronger outgassing relative to the insolation at perihelion. This need to introduce
such behaviour can be linked to the steepness of the brightness variation with
heliocentric distance that we saw in, for example, Fig. 1.3. While it is clear that
the physical explanations for the choice of this specific model are lacking, the fits to
the observables are reasonable and significantly improve upon the NGF models used
to date. Furthermore, the gas production rate required for the fit shows reasonable
agreement with rates estimated from data acquired by the ROSINA instrument
onboard Rosetta. Hence, this approach appears to have promise. To go further we
need to look at the source of the activity in more detail.
Fig. 1.18 Left: In blue residuals from a fit to the orbital position of the nucleus using a model of the
outgassing. The residuals in dark yellow (called ground-based) are based upon the NGF model of
Marsden et al. (1973) with A parameters obtained from the NASA/JPL Horizons system. Right: The
required total gas production rate to produce the fit (yellow line) is compared to ROSINA estimates
of the total gas production rate (blue crosses). From Attree et al. (2019) A&A, reproduced with
permission © ESO
26
1 Light Curves, Orbits, and Reservoirs