

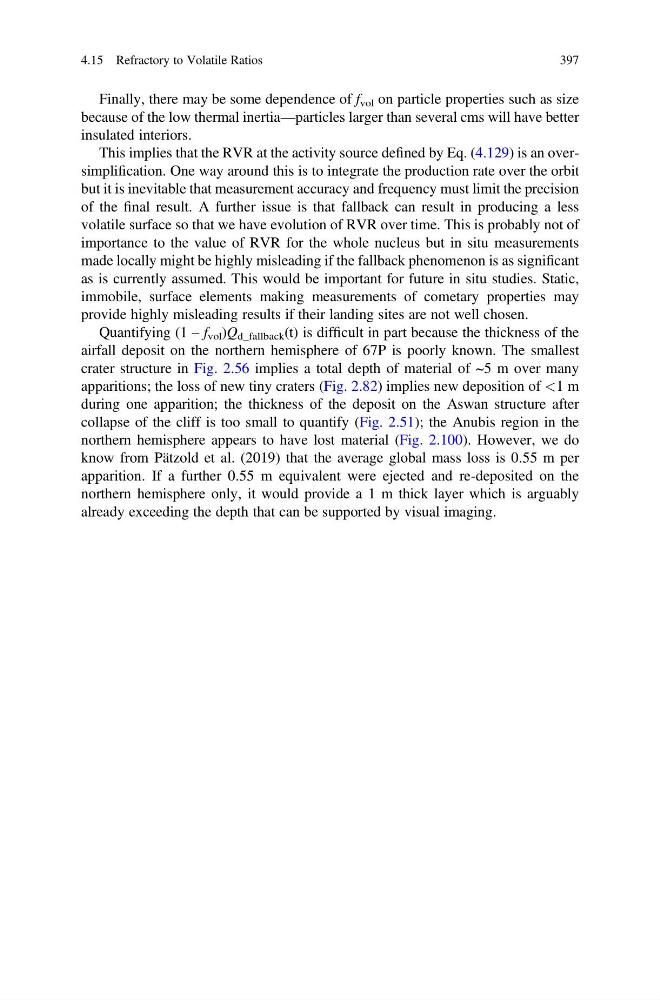
Finally, there may be some dependence of f vol on particle properties such as size
because of the low thermal inertia—particles larger than several cms will have better
insulated interiors.
This implies that the RVR at the activity source defined by Eq. (4.129) is an oversimplification. One way around this is to integrate the production rate over the orbit
but it is inevitable that measurement accuracy and frequency must limit the precision
of the final result. A further issue is that fallback can result in producing a less
volatile surface so that we have evolution of RVR over time. This is probably not of
importance to the value of RVR for the whole nucleus but in situ measurements
made locally might be highly misleading if the fallback phenomenon is as significant
as is currently assumed. This would be important for future in situ studies. Static,
immobile, surface elements making measurements of cometary properties may
provide highly misleading results if their landing sites are not well chosen.
Quantifying (1 – f vol )Q d_fallback (t) is difficult in part because the thickness of the
airfall deposit on the northern hemisphere of 67P is poorly known. The smallest
crater structure in Fig. 2.56 implies a total depth of material of ~5 m over many
apparitions; the loss of new tiny craters (Fig. 2.82) implies new deposition of <1 m
during one apparition; the thickness of the deposit on the Aswan structure after
collapse of the cliff is too small to quantify (Fig. 2.51); the Anubis region in the
northern hemisphere appears to have lost material (Fig. 2.100). However, we do
know from Pätzold et al. (2019) that the average global mass loss is 0.55 m per
apparition. If a further 0.55 m equivalent were ejected and re-deposited on the
northern hemisphere only, it would provide a 1 m thick layer which is arguably
already exceeding the depth that can be supported by visual imaging.
4.15 Refractory to Volatile Ratios
397
because of the low thermal inertia—particles larger than several cms will have better
insulated interiors.
This implies that the RVR at the activity source defined by Eq. (4.129) is an oversimplification. One way around this is to integrate the production rate over the orbit
but it is inevitable that measurement accuracy and frequency must limit the precision
of the final result. A further issue is that fallback can result in producing a less
volatile surface so that we have evolution of RVR over time. This is probably not of
importance to the value of RVR for the whole nucleus but in situ measurements
made locally might be highly misleading if the fallback phenomenon is as significant
as is currently assumed. This would be important for future in situ studies. Static,
immobile, surface elements making measurements of cometary properties may
provide highly misleading results if their landing sites are not well chosen.
Quantifying (1 – f vol )Q d_fallback (t) is difficult in part because the thickness of the
airfall deposit on the northern hemisphere of 67P is poorly known. The smallest
crater structure in Fig. 2.56 implies a total depth of material of ~5 m over many
apparitions; the loss of new tiny craters (Fig. 2.82) implies new deposition of <1 m
during one apparition; the thickness of the deposit on the Aswan structure after
collapse of the cliff is too small to quantify (Fig. 2.51); the Anubis region in the
northern hemisphere appears to have lost material (Fig. 2.100). However, we do
know from Pätzold et al. (2019) that the average global mass loss is 0.55 m per
apparition. If a further 0.55 m equivalent were ejected and re-deposited on the
northern hemisphere only, it would provide a 1 m thick layer which is arguably
already exceeding the depth that can be supported by visual imaging.
4.15 Refractory to Volatile Ratios
397