

made in reaching this result that are significant in that they suggest that this value
should be an upper limit. Firstly, Mie theory in general predicts a low reflectance at
90
phase angle. Irregular particles, such as those seen in Fig. 4.13, scatter more
efficiently at these intermediate scattering angles (see e.g. Fig. 4.11 for ellipsoidal
particles and note the logarithmic scale of the y-axis). In other words, Afρ becomes
larger for the same particle mass. Secondly, the gas production function of Hansen
et al. (2016) is higher than the more recent value of Biver et al. (2019) and higher gas
production rates drive higher gas velocities which in turn produce higher dust
velocities. Both of these effects would reduce the computed total dust mass loss
bringing the result closer to consistency. Increasing the dust size distribution power
law exponent to three would have a similar effect but here the measurement evidence
would argue against. Consequently, with some subtle manipulation, the Afρ values
can be claimed as consistent although using these values to define RVR would
obviously be over-interpretation of the data.
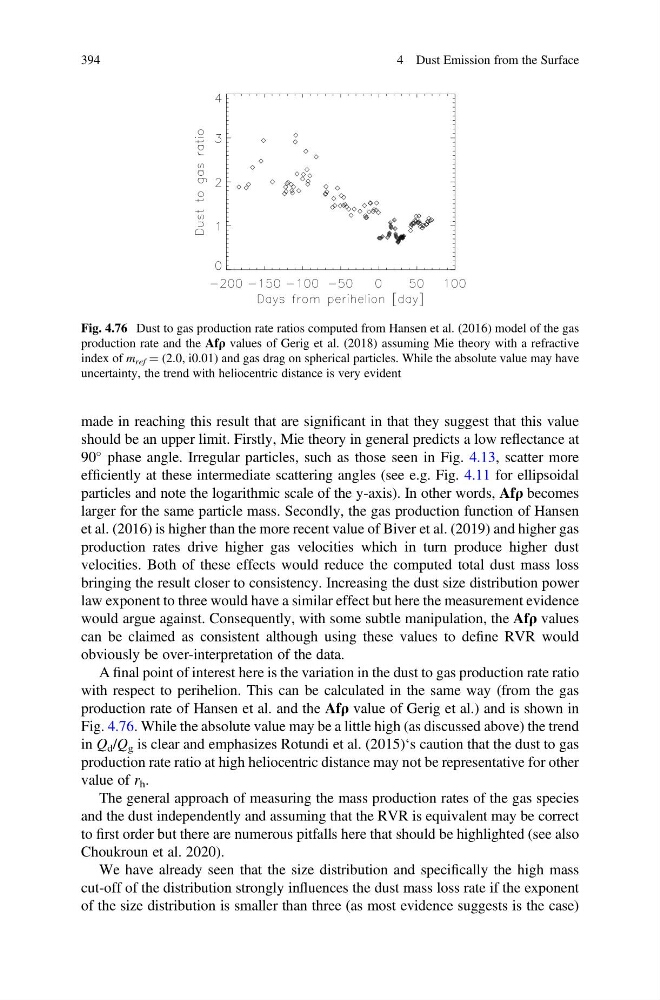
A final point of interest here is the variation in the dust to gas production rate ratio
with respect to perihelion. This can be calculated in the same way (from the gas
production rate of Hansen et al. and the Afρ value of Gerig et al.) and is shown in
Fig. 4.76. While the absolute value may be a little high (as discussed above) the trend
in Q d /Q g is clear and emphasizes Rotundi et al. (2015)‘s caution that the dust to gas
production rate ratio at high heliocentric distance may not be representative for other
value of r h .
The general approach of measuring the mass production rates of the gas species
and the dust independently and assuming that the RVR is equivalent may be correct
to first order but there are numerous pitfalls here that should be highlighted (see also
Choukroun et al. 2020).
We have already seen that the size distribution and specifically the high mass
cut-off of the distribution strongly influences the dust mass loss rate if the exponent
of the size distribution is smaller than three (as most evidence suggests is the case)
Fig. 4.76 Dust to gas production rate ratios computed from Hansen et al. (2016) model of the gas
production rate and the Afρ values of Gerig et al. (2018) assuming Mie theory with a refractive
index of m ref ¼ (2.0, i0.01) and gas drag on spherical particles. While the absolute value may have
uncertainty, the trend with heliocentric distance is very evident
394
4 Dust Emission from the Surface
should be an upper limit. Firstly, Mie theory in general predicts a low reflectance at
90
phase angle. Irregular particles, such as those seen in Fig. 4.13, scatter more
efficiently at these intermediate scattering angles (see e.g. Fig. 4.11 for ellipsoidal
particles and note the logarithmic scale of the y-axis). In other words, Afρ becomes
larger for the same particle mass. Secondly, the gas production function of Hansen
et al. (2016) is higher than the more recent value of Biver et al. (2019) and higher gas
production rates drive higher gas velocities which in turn produce higher dust
velocities. Both of these effects would reduce the computed total dust mass loss
bringing the result closer to consistency. Increasing the dust size distribution power
law exponent to three would have a similar effect but here the measurement evidence
would argue against. Consequently, with some subtle manipulation, the Afρ values
can be claimed as consistent although using these values to define RVR would
obviously be over-interpretation of the data.
A final point of interest here is the variation in the dust to gas production rate ratio
with respect to perihelion. This can be calculated in the same way (from the gas
production rate of Hansen et al. and the Afρ value of Gerig et al.) and is shown in
Fig. 4.76. While the absolute value may be a little high (as discussed above) the trend
in Q d /Q g is clear and emphasizes Rotundi et al. (2015)‘s caution that the dust to gas
production rate ratio at high heliocentric distance may not be representative for other
value of r h .
The general approach of measuring the mass production rates of the gas species
and the dust independently and assuming that the RVR is equivalent may be correct
to first order but there are numerous pitfalls here that should be highlighted (see also
Choukroun et al. 2020).
We have already seen that the size distribution and specifically the high mass
cut-off of the distribution strongly influences the dust mass loss rate if the exponent
of the size distribution is smaller than three (as most evidence suggests is the case)
Fig. 4.76 Dust to gas production rate ratios computed from Hansen et al. (2016) model of the gas
production rate and the Afρ values of Gerig et al. (2018) assuming Mie theory with a refractive
index of m ref ¼ (2.0, i0.01) and gas drag on spherical particles. While the absolute value may have
uncertainty, the trend with heliocentric distance is very evident
394
4 Dust Emission from the Surface