

1 (Divine et al. 1986). The absorbed power is given by Eq. 4.117 which allows us to
compute a particle temperature. Rather than using Eq. 4.118, for the radiated power
we can make a simplifying approximation by replacing the integral of Q abs over
wavelength with a single emissivity constant, ε, as is done for surfaces and using this
as a free parameter. This allows us to write
T
4
¼
1
4εσ
S ⨀
r 2
h
Z 1
0
Q abs λ
ð Þ
B λ T ⨀
ð Þ
k N
dλ
ð4:120Þ
so that the thermal spectral intensity is
I th λ
ð Þ ¼ 4
B λ T
ð Þ
k N
εσT
4
ð4:121Þ
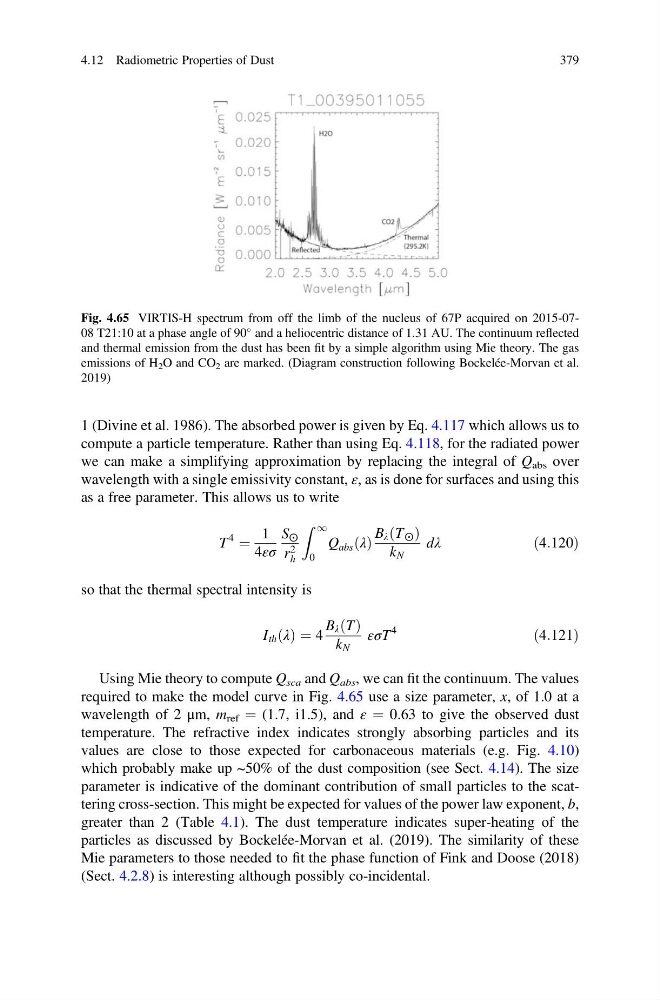
Using Mie theory to compute Q sca and Q abs , we can fit the continuum. The values
required to make the model curve in Fig. 4.65 use a size parameter, x, of 1.0 at a
wavelength of 2 μm, m ref ¼ (1.7, i1.5), and ε ¼ 0.63 to give the observed dust
temperature. The refractive index indicates strongly absorbing particles and its
values are close to those expected for carbonaceous materials (e.g. Fig. 4.10)
which probably make up ~50% of the dust composition (see Sect. 4.14). The size
parameter is indicative of the dominant contribution of small particles to the scattering cross-section. This might be expected for values of the power law exponent, b,
greater than 2 (Table 4.1). The dust temperature indicates super-heating of the
particles as discussed by Bockelée-Morvan et al. (2019). The similarity of these
Mie parameters to those needed to fit the phase function of Fink and Doose (2018)
(Sect. 4.2.8) is interesting although possibly co-incidental.
Fig. 4.65 VIRTIS-H spectrum from off the limb of the nucleus of 67P acquired on 2015-0708 T21:10 at a phase angle of 90
and a heliocentric distance of 1.31 AU. The continuum reflected
and thermal emission from the dust has been fit by a simple algorithm using Mie theory. The gas
emissions of H 2 O and CO 2 are marked. (Diagram construction following Bockelée-Morvan et al.
2019)
4.12 Radiometric Properties of Dust
379
compute a particle temperature. Rather than using Eq. 4.118, for the radiated power
we can make a simplifying approximation by replacing the integral of Q abs over
wavelength with a single emissivity constant, ε, as is done for surfaces and using this
as a free parameter. This allows us to write
T
4
¼
1
4εσ
S ⨀
r 2
h
Z 1
0
Q abs λ
ð Þ
B λ T ⨀
ð Þ
k N
dλ
ð4:120Þ
so that the thermal spectral intensity is
I th λ
ð Þ ¼ 4
B λ T
ð Þ
k N
εσT
4
ð4:121Þ
Using Mie theory to compute Q sca and Q abs , we can fit the continuum. The values
required to make the model curve in Fig. 4.65 use a size parameter, x, of 1.0 at a
wavelength of 2 μm, m ref ¼ (1.7, i1.5), and ε ¼ 0.63 to give the observed dust
temperature. The refractive index indicates strongly absorbing particles and its
values are close to those expected for carbonaceous materials (e.g. Fig. 4.10)
which probably make up ~50% of the dust composition (see Sect. 4.14). The size
parameter is indicative of the dominant contribution of small particles to the scattering cross-section. This might be expected for values of the power law exponent, b,
greater than 2 (Table 4.1). The dust temperature indicates super-heating of the
particles as discussed by Bockelée-Morvan et al. (2019). The similarity of these
Mie parameters to those needed to fit the phase function of Fink and Doose (2018)
(Sect. 4.2.8) is interesting although possibly co-incidental.
Fig. 4.65 VIRTIS-H spectrum from off the limb of the nucleus of 67P acquired on 2015-0708 T21:10 at a phase angle of 90
and a heliocentric distance of 1.31 AU. The continuum reflected
and thermal emission from the dust has been fit by a simple algorithm using Mie theory. The gas
emissions of H 2 O and CO 2 are marked. (Diagram construction following Bockelée-Morvan et al.
2019)
4.12 Radiometric Properties of Dust
379